Why DIY machines will ring up big sales for some EMS/ODMs.
Self-service intelligent kiosks have evolved over the years, gaining increased functionality, yet have their origins in traditional food and beverage vending machines. These machines were originally electromechanical in design, but now are largely electronic today, with multiple embedded modules and communications functions integrated into the design.
The word “kiosk” is today used to describe a variety of user-interactive dispensing systems that can include ATMs (automated teller machines), POS (point of sale) devices, gaming/arcade equipment, and a variety of self-service systems within the transportation, retail and product goods industries. Each year, these kiosks become more technically advanced in terms of the kinds of merchandise they can handle, the variety of payment options they can conduct, and the new ways of communication interaction (e.g., video, Wi-Fi and near field communications).
In most cases, these features are application-specific to each market. For example, in the ATM market there is need for counterfeit recognition, bill paying, and in some situations, interactive video. In the gaming industry, there is demand for new forms of gambling/betting online for cash verification and interactive forms of communications for play. Self-service kiosks can now distribute a wide variety of merchandise, including food, beverages, DVDs, batteries, and many kinds of consumable goods.
In all cases, the functioning hardware needs to securely dispense, transact and sometimes collect products, all on a standalone, self-maintaining, self-diagnosing basis. This requires sophisticated product design skills, as well as excellence in manufacturing.
Based on the number of suppliers within each product segment, the market for the assembly of complex kiosk systems, New Venture Research estimates the total market assembly cost was approximately $21 billion in 2013 (Figure 1). EMS subcontractors account for approximately 21% of all product builds, mostly in the gaming and self-service kiosk market segments. OEMs account for the remaining assembly being done in-house, as there are high barriers to entry that pertain to industry hardware functionality and legacy systems, which for the foreseeable future will remain in the control of the OEM (Table 1).
Table 1. Total Assembly COGS for Complex Kiosk Systems by Product and Supplier, 2013
A number of EMS suppliers serve this marketplace on a subcontract basis. The majority of manufacturing performed today is PCB assembly, yet firms such as Flextronics and others offer full-system assembly, including reference designs, IP technology, and systems integration and product differentiation. Vice president Dave Gonsiorowski claims Flextronics has completed over 200 projects in the complex kiosk market segment. To this end, the company has received accolades from Redbox Automated Retail (a division of Outerwall that makes DVD rental kiosks), which has deployed a reported 36,000 transaction stations. Concerning industry evolution, he remarks, “You’re seeing convergence for sure. Also, the equipment is getting smarter and is part of the ‘big data’ movement. These systems can generate an enormous amount of information. They can track any of the information that the customer is using from these systems. So telemetry, big data and smarter equipment and self-healing: these are all things that the equipment can do now. We’re finding that the shoppers want to shop their way, when they want it and where they want it. The retail marketplace has a number of these products, and they all operate and communicate with each other in many ways.”
Regarding industry supplier composition, Jeff Doerr, senior manager of business development at Flextronics, points out, “The industry is made up of a handful of large OEMs that specialize in niche markets with niche products. These firms are developing technologies for their own consumption. There are a number of smaller kiosk integrators with revenues ranging from $1 million to $50 million that tend to focus more on integration of existing technologies. Unlike OEMs, these companies typically outsource all manufacturing/painting, then bring components, enclosure, etc., in-house for assembly. Typical projects range from one to 200 units, often with some level of customization, but usually are not very complex. Our advantage is that we are a world leader in the design, manufacturing, service and logistics of these technologies. We get to leverage our experiences in all areas of design and manufacturing.”
Sinocan is an Asian OEM manufacturer positioning itself as an ODM of complex kiosk products. Similarly, Kontron (a designer and manufacturer of embedded printed circuit boards) has strategically partnered with Plexus to offer unique ODM/OEM services for complex kiosk solutions. Foxconn is reported to have an ODM design group (FoxKPC) focused on POS and ATM products. Jabil has considerable experience in ATM/POS card readers, cash dispensers, large-form kiosks, and multifunctional automation equipment. Benchmark Electronics also has its eye on this market through its joining of the Intel Systems Alliance group to develop its business in the field of embedded computing, as do Sanmina-SCI and Celestica.
Figure 2 summarizes the total assembly COGS for complex kiosk systems by geographic region in 2013. These figures were calculated by examining each company’s sales and manufacturing operations and making estimates of production by region. APAC (Asia/Pacific, Australia, China – includes India) accounts for the largest production base, followed by the Americas and EMEA (Europe, Middle East, Africa). While APAC leads in product assembly, the Americas accounted for more than half of all EMS production in 2013.
Figure 2. Total assembly COGS for complex kiosk systems by region ($21 billion), 2013.
ATMs. ATMs account for the most feature-rich, complex kiosk systems, as well as the most extensive installed base. As with most products, they can come in different configurations and cost, with bare bones models representing approximately $2,500 in assembly value and as high as $30,000 for high-end systems with a variety of features (counterfeit detection, cash recycling, video interface, multiple currencies, etc.). Lately, cheap Asian designs have been making their way into the market, offering opportunities for installations in new locations not previously available.
The internal bill counting and dispensing mechanisms are the critical features to the ATM, as cash must be recognized, verified, sorted and capable of being returned. State-of-the-art end-systems image each note (both sides) and can recognize and capture counterfeit bills. Prices for systems are largely determined by how many bills the ATM can manage, with low-end systems capable of managing 1,000 bills and high-end systems capable of managing up to 12,000 bills.
The leading ATM OEM companies include GRG Banking (China), Diebold, Fujitsu, Glory (Japan), Wincor-Nixdorf and NCR. Respondents interviewed indicated that the market was growing very strongly, at more than 10% a year, largely in developing economies where cash is king. Cashless solutions in the developed countries are an emerging market, but there are many countries such as Russia, India and China where cash is still the preferred payment option. In many cases, people are uncomfortable with cashless payment solutions, but may use an ATM kiosk to pay bills and obtain products or services. Asian suppliers dominate this TAM by more than half.
Bessam Estaitieh, director of marketing at Crane Payment Solutions, observes that the most promising markets are in emerging countries like India and China. “The options from the kiosk depend on the country you are looking at. For example, in India in suburbs or rural areas, it might not make much sense to deploy cashless options, so cash is still the preferred method of payment. Russia is a mature country when it comes to bill payment kiosks, so growth is more moderate there than other countries. China is growing strong, and India has over a billion people who are cash-oriented. Another variable is the model, where in Russia it is a multi-operator solution versus China, where it is a single operator solution. For example, there are two wireless providers in China, the largest one with 750 million-plus subscribers that can afford to deploy its own kiosks. The rest of the world has smaller operators; it becomes a business case decision based on maturity and experience, in terms of single vs. multi-operator model. Each country is unique. You can’t paint the world with one brush; it depends on its history, government, and how capitalistic it is, so you have to develop a geographic approach.
“On the kiosk side, most of the market globally is in the emerging world. I cluster kiosks into four distinctive geographic areas. The most mature kiosk market is Russia, followed by China in terms of deployment size. The US is third, followed by RoW. The Russian culture is very much focused on cash and anonymity, and they prefer to use kiosks. They provide a good model for the rest of the world. For example, there is a kiosk OEM that provides the kiosk; then there is an operator that purchases the kiosk and runs it to enable payment for service from multiple providers. A popular application is to top off your cellphone or pay your utility bill and other things. Each cellphone company or utility doesn’t have to develop its own kiosk, which would not be cost-effective. It simply connects to a payment network, and the kiosk operator charges a per-transaction fee.”
Terra Nofsinger, AVP, merchant sales specialist for Bank of America, notes that the ATM selected by the merchant depends on how many notes the merchant wants to be able to transact. “If you think about an ATM dispensing 3000 notes a day, which may take two or three salaried tellers the same amount of time and work to do, it becomes a situation in which the ATM could have a payback of several months. It sounds bad to be replacing workers with machines, but in fact these ATMs are much more accurate and cost-effective when compared to human labor. They don’t take coffee breaks, and they work 24 hours a day.”
Gaming. Manufacturing equipment for gaming companies (those engaged in slot machine, arcade, and cash acquisition/exchange systems) is a vast industry that has been well-penetrated by EMS companies, and is still a growing market due to technology development. Electronic gambling in North America has matured (blackjack, poker, bingo, etc.), but in Asia (and Europe to a lesser degree), it is growing dramatically as the gambling market expands. In most cases, however, gamblers prefer interacting with live people than with machines in this region.
The gaming market is constrained in a similar way to the ATM market by people who prefer to transact exclusively in cash. Cashless solutions that involve credit/debit cards are still developing in the emerging economies, but gaming kiosks (frequently ATMs) that accept credit are becoming more common and trustworthy as the world evolves toward electronic systems. Solutions involving credit devices that exchange cash for winnings, or ticketing credits, are becoming increasingly commonplace, and market growth appears to be emerging principally in Asia, where the market is expanding so rapidly.
Outsourcing of gaming equipment assembly has been robust for many years in North America and Europe. Many of the contracts have gone to second and third tier EMS suppliers because of the complexity of the assembly requirements, which often involve a high degree of electromechanical production capabilities, but also because of the vertical niche nature of the industry. Often, large gambling companies prefer turnkey assembly capabilities of smaller and local suppliers that specialize in understanding the technical demands of federal and state entities for transparency and legality. As this varies considerably between country and state, compliance often becomes a deciding factor.
POS. Point of sale (POS) equipment normally includes a wide range of cash registers and check-out stations found in today’s retail outlets. A complex kiosk POS system can be seen in self-checkout stations at local grocery markets and, increasingly, at retail stores. Although vending machines might be considered in this category, we are avoiding this avenue because of the commodity-like nature of these systems.
NCR, Wincor-Nixdorf and Toshiba have long been leaders in POS equipment, and the development of complex kiosk POS solutions has naturally emerged from this expertise. The market naturally split between commodity cash register machines for retail and higher-end, networked systems for large-scale super-store operations that are more comprehensive in terms of features and reliability.
EMS assembly of complex POS kiosks has been constrained to date, as the manufacturing of these solutions involves the integration of numerous sub-systems, including barcode technology, cash handling equipment, credit/debit card transaction, display/audio technology, communications, and the weighing of purchased items. While these systems are becoming more commonplace, they are rarely turnkey in nature and thus require a considerable amount of customization and systems integration. NCR and Wincor-Nixdorf have been shown to be the most progressive by subcontracting PC board assembly where their systems are sold, and Flextronics has shown to be the primary supplier of customized solutions.
Randy Fox, vice president of currency handling and identity product solutions for Fujitsu’s cash management and recycling operations, offered several comments concerning the evolution of the industry. “People have been talking about cash going away for the last 30 years, but the simple fact is there is more cash in circulation today than ever before. We see the need for cash, and the need for cash handling, growing. There is certainly growth in first-world markets like the US for cash management. Cash is discreet, private and is not regulated, particularly in the second economies where you have a lot of immigrants who do not feel comfortable using credit instruments. We look at the market growing in terms of applications such as gaming and hospitality. Also retail and banking, but growing in markets where cashless hasn’t been used. All of the kiosk vendors are asking that question, but you have to understand that every market in every application is different.”
Parking/ticketing. Parking and ticketing kiosks are a vertical application because of the technology sophistication, which is of the order of an ATM. Yet these solutions must operate in harsh conditions and environments. Leading suppliers include Fujitsu, Ingersoll Rand, Amano and 3M.
Aaron Mills, a marketing executive at 3M, perceives the market in this way: “What we focus on today is primarily what is called off-street parking. So the market is split pretty much 50/50 with off-street parking and on-street parking. The on-street systems are getting more complex. The technology you’re seeing now – there is a box or kiosk that you go up and pay. There isn’t a parking meter anymore. There is just a number and a pay-and-display system. So it’s evolving, but we don’t make them. The on-street parking is almost totally owned by the cities.
“Off-street parking systems have a lot more advanced technology. It’s mainly garages, but there are also parking lots with a gate. There is also free parking that needs to be controlled. For example, in the hospital, there are doctors and nurses and people who need to park and gain access, so you scan your card and the gate will open. Sometimes, the hang-tag that you find at universities works by RFID. Most of what we do is on the revenue control side with paid parking.”
Industry averages show that a typical parking system in a garage consists of two lanes in and two lanes out. Some solutions are fully automated, while others decide to use a cashier in the lane to accept payment. Equipment costs for an automated, two-in, two-out system range from $60,000 to $100,000, depending on system complexity.
Kiosks – retail/transportation. Retail and transportation kiosks are becoming increasingly common in stores, hotels, sports centers, hospitals, restaurants, courthouses, delis, museums, airports, subways and train stations. As such, they tend to be more application-specific, such as issuing a boarding pass at an airport and transacting a debit for the luggage fee. Because they frequently do not handle cash, these kiosks cost less and are less complex to build. A number of suppliers serve this market in all regions across the world. Leading suppliers include Fujitsu, GRG Banking, Wincor-Nixdorf, NCR and Triton.
Outsourcing of these so-called lightweight types of retail kiosks is becoming more common. While not commodity in nature, they can be assembled with standard components, including scanners, displays and printing technology, as opposed to a much more expensive and customized system.
Flextronics’ Gonsiorowski summarizes the market in this way: “Depending on the niche of this segment looked at, you will see different trends. Information kiosks tend to be commodity, as are digital signs, mobile devices and tablets. Established markets like ATMs and gas pumps tend to still be integrated in-house with the use of outsource providers offering components. Automated storefronts, on the other hand, tend to be custom. The brands are very interested in having the machines match their brands and deliver interactions consistent with their brands. They are very particular about how they interact with customers, and want the systems to be customized to the experience they want to deliver. We also see a trend where brand companies working with their creative agencies are coming up with new and innovative concepts for self-service. These companies are trending toward outsourced strategies.”
Kiosks – self-service. The most popular and fastest growing market for complex kiosk systems seems to be self-service solutions. Well-known products include DVD rentals (RedBox/Outerwall, Inc.), automobile rental stations (Hertz), and more recently battery purchasing/recycling (BETTERY – now discontinued), convenience products (Store24), bicycle rentals (B-Cycle), electrical recharging stations (Charge It Spot), and represent an attractive and sizable market segment with emerging companies that are brimming with ideas.
Outsourcing of assembly of self-service kiosks is more extensive than any other market segment. This is because the largest region for these systems is found in North America, where OEMs do not want to manufacture and need a good partner to assists their product launch. In some cases, the subcontractor is not an EMS company but an OEM/ODM with its own branded product and intellectual property that it wants to license. As such, this market is growing very rapidly in North America.
Demand for self-service kiosks appeals to retailers who are always looking for ways to boost sales and install offerings that appeal to customers that bring them back to the store. These systems are designed so that all communications are completely secure in terms of credit card transactions, inventory management and software updates, often handled wirelessly over a cellular network. Flextronics’ Gonsiorowski states, “There are still markets and good reasons for some solutions to be a mix of automation and people.”
“I believe what we have learned about self-service over the past 15 years is that the equipment can provide the consistent transactions and, in many cases, more information. There are still some products and services where human interaction is still very important. In these cases, we see a trend where the human is there to provide the human interaction, but the equipment is there to ensure the information and transactions are delivered consistently.”
Trying to decide on a make vs. buy business model, suppliers sometimes create a hybrid solution that involves standard components and modules such as displays and credit card transaction devices, with custom dispensers that accept and recycle products to returning customers. In these situations, there are companies that specialize in retail automation solutions that leverage many existing designs to avoid starting a project from scratch. The mix of original and reused technology is frequently 40:60 for existing vs. custom solutions.
Fujitsu’s Fox summarizes the state of the industry this way: “The componentry is getting more and more miniaturized, so we can get into new applications in which the price point is coming down. There is the advent of new, miniaturized, low-cost cash dispensing technologies. There certainly is growth in cashless payment, such things as mobile POS and electronic commerce. The pie overall is growing. All boats are being lifted because the pie is growing.”
Want a quick response to the PCB assembly RFQ? Submit the full package of details.
Design projects that are actually completed with time to spare are few. We do what we can, but breaking new ground invariably uncovers a few snakes in the brush, and dealing with them takes time. That means that the next step – production ramp – starts behind schedule. At that point you need to get assembly quotes back ASAP so a choice can be made and the trigger pulled to get product flowing.
Some contract assemblers could provide a working number within a few days, but it would come with a list of caveats and unknowns and escalator clauses. Do you really want to commit to the program manager, the CEO, or worse, the market, with a number that guarantees a loss of profit (bid too low) or a loss of sales (bid too high)? Not if it could be avoided, of course. So let’s start by pulling together the documentation that engineering has, plus the implementation that marketing envisions, plus the ramp time the boss has in mind.
Kit build (labor only), turnkey (labor and all materials), or a blend?
Build, release, and EAU (estimated annual units/usage) quantities.
BoM (bill of materials), including off-the-shelf part number, source, tolerances, alternatives, and count. Note those that are OEM-provided.
If a component is obsolete, should it be broker-sourced, replaced or reengineered?
OEM, EMS, or outside service to program ICs?
PCB Gerber files, including board specification(s), quality level, panelization (x-outs OK?), and certifications (RoHS, ITAR, etc.).
3D CAD drawings with specs of custom parts (including the PCB) and current sources (if any).
Assemblies supplied still in an array, as individual boards, or in final enclosures?
Final assembly procedures required: conformal coating (type), potting, ultrasonic staking.
Post-assembly procedures required: burn-in, temperature cycling (powered or unpowered), cycles and duration.
QC testing: limited, AOI, fully functional; are test hardware and software provided?
Golden sample and schematic available for test setup and aesthetic comparison?
Packaging required (ESD, padded, consumer boxed, quantity per carton, etc.)?
Percent shipment overage/underage acceptable?
Planning, quality and professionalism do not cost; they pay. Even with this list, questions might occur, but expect fewer interruptions to track down missing details and a more realistic cost, faster.
Figure 1. The EMS should take adders such as manual assembly into the equation. Robert Simon is a veteran of technology development and marketing, having worked R&D and marketing for electronics, polymer, and metal companies, including Bayer AG of Leverkusen Germany and Battelle Memorial Institute of Columbus, Ohio, before founding USTEK Inc.; This email address is being protected from spambots. You need JavaScript enabled to view it..
A new CAD tool imports design files and quantitatively predicts product life.
Previous approaches to reliability assurance included “gut feel,” empirical predictions such as MIL-HDBK-217 and TR-332, industry specifications, “lessons learned” programs, failure mode effects analysis, and test-in reliability schemes. While these approaches can provide some value, it is felt that the most comprehensive analysis can best be done virtually using computer modeling of the circuit board in the intended environment. Such modeling can predict the life and reveal any design weaknesses before any prototype boards are even built.
The motivation for using modeling software lies in ensuring sufficient product reliability. This is critical because markets are lost and gained over reliability. Reputations can persist for years or decades, and hundreds of millions of dollars are at stake.
Using an automotive example, some common costs of failure:
Total warranty costs range from $75 to $700 per car.
Failure rates for E/E systems in vehicles range from 1 to 5% in first year of operation (Hansen Report, April 2005).
Difficult to introduce drive-by-wire, other system-critical components.
E/E issues will result in increase in “walk home” events.
Other Costs of Failure Examples Type of BusinessLost Revenue/ Hour Retail brokerages $6,450,000 Credit card sales authorization $2,600,000 Home shopping channels $113,750 Catalog Sales Centers $90,000 Airline reservation centers $89,500 Cellular service activations $41,000 Package shipping services $28,250 Online network connect fees $22,250 ATM service fees $14,500 Supermarkets $10,000
The foundation of a reliable product is a robust design. A robust design provides margin, mitigates risk from defects, and satisfies the customer. Assessing and ensuring reliability during the design phase maximizes return on investment. The cost associated with finding a design flaw increases greatly the longer it takes to find it. Some have estimated this cost to be:
Found during design: 1x.
Found during engineering: 10x.
Found during production: 100x.
Found at customer: 1000x.
Electronics OEMs that use design analysis tools hit development costs 82% more frequently, average 66% fewer respins and save up to $26,000 in respins.1
MTTF / MTBF. Many companies use mean time to failure or mean time between failures calculations as their only means of assessing the reliability of their product while in the design stage. MTTF applies to non-repairable items, while MTBF applies to repairable items. They are based on the exponential distribution:
MTBF is typically calculated through a parts count method. Every part in the design is assigned a failure rate. This failure rate may change with temperature or electrical stress, but not with time. Failure rates are summed and then inverted to provide MTBF. Most calculations assume single point of failure, while some calculations take into consideration parallel paths.
A variety of handbooks provide failure rate numbers. These include MIL-HDBK-217, Telcordia, PRISM, 217Plus, RDF 2000, IEC TR 62380, NSWC Mechanical, Chinese 299B, HRD5. Some companies use internally generated numbers.
MTBF/MTTF calculations tend to assume that failures are random in nature and provide no motivation for failure avoidance. And, it is very easy to manipulate numbers with tweaks made to reach desired MTBF, such as modifying quality factors for each component. These calculations are also frequently misinterpreted. Example: A 50,000 hr. MTBF does not mean no failures in 50,000 hr.; it means half the products could fail by 50,000 hr. Basically, these calculations are a better fit toward logistics and procurement, not failure avoidance. Furthermore, these calculations take into account only failure of the components on the board, not wear-out mechanisms such as solder joint failures, plated through-hole fatigue, or damage due to vibration or shock events.
Design-build-test-fix approach. A common approach to product development is the design-build-test-fix (DBTF) approach. This is essentially a trial-and-error approach where the product is designed and prototypes are built. These prototypes then undergo testing; failures/defects are discovered; corrections are made in the design, and more prototypes are made, etc. Traditional OEMs spend almost 75% of product development costs on this approach.2 Shortcomings of this approach include:
All design issues often not well-defined.
Early build methods do not match final processes.
Testing doesn’t equal actual customer’s use.
Improving fault detection catches more problems, but causes more rework.
Problems found too late for effective corrective action, fixes often used.
Testing more parts and more/longer tests “seen as only way” to increase reliability.
Cannot afford time or money to test to high reliability.
Recommended Design Approach
To design a product with the best chance for optimal reliability, one must understand the primary wear-out mechanisms and failure modes (often referred to as physics of failure). These wear-out modes can then be modeled and avoided with proper design improvements. One must also understand the expected life of the product and environment that the product will be exposed to over the course of its life. Finally, state-of-the-art tools should be used to understand the design and its impact on reliability before prototypes are built (while product is still in the design stage).
Electronics failures are typically attributed to a quality defect, overstress or wear-out. Quality defects often result from mistakes made in manufacture of the component or in PCB assembly. Design for manufacture and Six Sigma quality controls are required to minimize such defects and are outside the scope of this article. Overstress failures occur when a product is used outside its intended purpose or is exposed to an environment for which it was not intended (example, dropping your iPhone in the commode). This mode of failure is also outside the scope of this article. Avoiding wear-out failures in an electronics product is the focus since these failure modes can be modeled using established algorithms.
Wear-out failures have become much more common with aggressive design practices to shrink the footprint of electronics and design-in more applications. This has led to smaller, more closely spaced solder joints and through-hole vias. IC packages also have lower standoff and thus exert higher stress on solder joints during thermal cycle excursions. Additionally, lead-free solders have been introduced, which require higher assembly temperature and have different mechanical properties. The advantage of wear-out failures is that we can understand how these failures take place and model them. For example, one researcher found that 65% of electronic failures were due to thermo-mechanical effects (CTE differences or diffusion).3 Common wear-out failure mechanisms that are modeled with Sherlock modeling software include:
Thermal-cycle fatigue of solder joints.
Mechanical vibration failure of solder joints.
Shock failure of solder joints.
Plated through-hole fracture.
Understanding Product Environment
Desired lifetime and product performance metrics must be identified and documented. The desired lifetime might be defined as the warranty period or by the expectations of the customer. Some companies set reliability goals based on survivability, which is often bounded by confidence levels such as 95% reliability with 90% confidence over 15 years. The advantages of using survivability are that it helps set bounds on test time and sample size and does not assume a failure rate behavior (decreasing, increasing, steady-state).
If the environment in which the product will be shipped and used is understood, then these conditions can be inserted in the model, and their impact on wear-out failure can be calculated. Mechanical vibration and shock, as well as thermal excursions, during shipping can be estimated depending on how the product is transported. Some products require long storage times or aggressive storage conditions, and these can also be modeled. Of greatest concern is how the product is used by the customer. One must estimate the number and magnitude of temperature excursions and mechanical stresses that the product will be exposed to while in use.
Defining environments. Several commonly used approaches are used to identify the environment. One approach involves the use of industry/military specifications such as MIL-STD-810, MIL-HDBK-310, SAE J1211, IPC-SM-785, Telcordia GR3108, and IEC 60721-3. Advantages of this approach include the low cost of the standards, their comprehensive nature and consensus industry agreement. If information is missing from a given industry, simply consider standards from other industries.
Disadvantages include the age of the standards; some are more than 20 years old, and lack validation against current usage. The standards both overestimate and underestimate reliability by an unknown margin (Figure 1).
Figure 1. Some standards, such as IPC-SM-785, are too old to be inherently valid for today’s use.
Another approach to identifying the field environment is based on actual measurements of similar products in similar environments. This gives the ability to determine both average and realistic worst-case scenarios. All failure-inducing loads can be identified, and all environments, manufacturing, transportation, storage and field can be included.
In addition to thermal cycle environments, the reliability software accepts vibration and shock input as well. Figure 2 shows representation of this input. Identify the number of natural frequencies to look for within the desired frequency range. Single point or frequency sweep loading is available, and techniques are also available to equivalence random vibration to harmonic vibration.
Figure 2. Environmental profiles inserted into software for modeling.
Vibration loads can be very complex and may consist of sinusoidal (g as function of frequency), random (g2/Hz as a function of frequency) and sine over/on random. Vibration loads can be multi-axis and damped or amplified depending on chassis/housing.
Transmissibility. The response of the electronics will be dependent on attachments and stiffeners. Peak loads can occur over a range of frequencies, including the standard range of 20 to 2000Hz and an ultrasonic cleaning range of 15 to 400kHz.
Vibration failures primarily occur when peak loads occur at similar frequencies as the natural frequency of the product or design. Some common natural frequencies:
Larger boards, simply supported: 60 - 150Hz.
Smaller boards, wedge locked: 200 - 500Hz.
Gold wire bonds: 2kHz - 4kHz.
Aluminum wire bonds: >10kHz.
Import files. The software is designed to accept ODB files, which contain all the data for the PCB, the components and their locations. Data can also be imported with Gerber files and an individual bill of materials (BoM). Figure 3 shows an example of a PCB stack-up and relevant data for reliability modeling.
Figure 3. PCB layer viewer and relevant data.
Parts list. Individual component data is part of the ODB file; however, modifications to the data can be made manually to ensure physical characteristics of all the components are accurate. Figure 4 shows the component editor, and Figure 5 shows the laminates and their properties that are embedded in the software.
Figure 4. Parts list package database editor.
Analyses. Six analyses are currently conducted:
CAF (conductive anodic filament) formation.
PTH fatigue.
Solder joint fatigue.
Finite element simulations.
Natural frequencies.
Vibration fatigue.
Mechanical shock.
Figure 5. Laminate manufacturers.
CAF formation. Conductive anodic filament formation is when electrochemical migration of copper occurs between two barrel vias (Figure 6). The migration occurs through the PCB laminate and not on the surface (which is considered a different defect mechanism).
Figure 6. CAF formation between vias within the PCB.
One factor that drives CAF is damage to the laminate surrounding the drilled via. This can occur from a dull drill bit, excessive desmear etching or poorly laminated layers. Environmental factors that can increase the likelihood of CAF formation are the voltage across neighboring vias, spacing of the vias, and high temperature/humidity conditions. The software evaluates the edge-to-edge spacing of all the vias on the board and estimates the risk of CAF formation based on the damage around each via, as well as how well the product was qualified with CAF testing. Such vias can then be assessed to determine if there is a high voltage potential between them, or if they could be exposed to high humidity conditions.
PTH fatigue. PTH fatigue occurs when a PCB experiences thermal cycling. The expansion/contraction in the z-direction is much higher than that of the copper that makes up the barrel of the via. The glass fibers constrain the board in the x-y plane, but not through the thickness, so z-axis expansion can range from 40 to 70 ppm/°C. As a result, a great deal of stress can be built up in the copper via barrels, resulting in eventual cracking near the center of the barrel, as shown in the cross section photos in Figure 7.
Figure 7. PTH fatigue images.
A validated industry failure model for PTH fatigue is available in IPC-TR-579, which is based on round-robin testing of 200,000 PTHs performed between 1986 and 1988. This model used hole diameters of 250µm to 500µm, board thicknesses of 0.75mm to 2.25mm and wall thicknesses of 20µm and 32µm. Advantages include the analytical nature in using a straightforward calculation that has been validated through testing.
Disadvantages include the lack of ownership and validation data that is approximately 20 years old. The model is unable to assess complex geometries, including PTH spacing and PTH pads that tend to extend lifetime. It is also difficult to assess the effect of multiple temperature cycles. However, this assessment can be performed using Miner’s Rule. The PTH equations take into account the expansion coefficient, PCB thickness, copper thickness, via diameter and glass transition temperature.
In addition to the series of algorithms used to calculate the fatigue life of PTHs, the quality of the copper plating is also taken into account. The “PTH Quality Factor” is a means of estimating the quality of the PTH fabrication process. This is a somewhat subjective determination. Rough edges of the copper wall will provide crack initiation sites and would reduce the quality. On the other hand, smooth copper walls, along with a surface finish such as ENIG, would improve the quality of the PTH. An example of a failure curve for PTH thermal cycle fatigue is shown in Figure 8, along with a list of vias in order of their expected life.
Figure 8. PTH fatigue life prediction.
Solder joint fatigue. Solder joint fatigue failures are becoming more prevalent due to the continued shrinkage of solder joint size and pitch that comes with more advanced packages. The reliability software takes into account the physical characteristics of the package and PCB to calculate thermal cycle fatigue life of the solder joints. The user may select eutectic tin-lead (SnPb), SAC 305 or SN100C (SnCuNiGe). Solder may be specified at the board or component level.
Solder Fatigue Model: Modified Engelmaier
The modified Engelmaier model is used within the software, which is a semi-empirical analytical approach using energy-based fatigue.
First, determine the strain range, Δγ, using:
where C is a correction factor; LD is diagonal distance; a is CTE; ΔT is temperature cycle, and h is solder joint height. C is a function of activation energy, temperature and dwell time. LD is described further. Da is a2 – a1 and hs s defaults to 0.1016mm.
Next, determine the shear force applied to the solder joint using: where F = shear force, LD = length, E = elastic modulus, A = area, h = thickness, G = shear modulus, and a = edge length of bond pad.
For the subscripts: 1 is the component; 2 is the board; s is the solder joint; c is the bond pad, and b is the board. This model takes into consideration foundation stiffness and both shear and axial loads. Leaded models include lead stiffness.
Figure 9. Tabular PTH fatigue life data.
Area. A1 is thickness of component (h1) x solder joint width, and A2 is thickness of board (h2) x solder joint width. As is length of solder joint (Ls) x solder joint width, which defaults to 45% of LD.
Ac is the length of the bond pad (Lc) x solder joint width. Lc defaults to 60% of LD.
Remaining parameters (h, G, v, a). Thickness: hs defaults to 0.1016mm, and hc defaults to 0.035mm.
Gs = Es / 2 x (1+vs) where Es = Temperature dependent modulus of solder and vs = 0.36.
Gc = Ec / 2 x (1 + vc) where Ec = 120 GPa and vc = 0.3.
Gb = Ec / 2 x (1 + vb) where Eb = 17 GPa and vb = 0.18.
a = √As.
Then, determine the strain energy dissipated by the solder joint using:
Calculate cycles-to-failure (N50), using energy-based fatigue models for SAC developed by Syed – Amkor:
and using the energy-based model for SnPb
The software also has user overrides for solder fatigue.
Validation of Modeling Results
How accurate are the software’s modeling results compared with actual data? To answer this, more than 100 models were run with individual components and the results compared with reliability data from the literature. The results for QFNs, QFPs and BGAs are shown in Figure 10. The predicted results are on the x-axis and the modeled results on the y-axis. A perfect model would result in a diagonal line.
Figure 10. Predicted thermal cycle results compared with modeling results.
Naturally, there is variation in the results; however, for the most part, the predicted results are within a 10% band of the actual data. A larger scatter in data is seen for BGAs, as is typical of experimental results for these components.
Unreliability. Thermal cycle results are provided as an unreliability plot that represents the cumulative reliability of all the components on the circuit card assembly (CCA) (Figure 11). The software will also show the rank order of individual components and their respective reliability so that the weakest links are determined (Figure 12). When a product consists of several CCAs, an unreliability failure plot is provided that takes into account all the assemblies.
Figure 11. Solder joint fatigue life prediction (representing a very harsh under hood environment).
Figure 12. Sherlock results table.
Natural frequency analysis. The software contains an embedded finite element modeling tool that allows the user to select the mesh size and angle. The FEA is used to calculate the natural frequencies of the CCA, as well as the vibration and shock behavior. An example of the mesh created for a CCA is shown in Figure 13, followed by the first natural frequency generated for the assembly – based off the mount points used for the card.
Figure 13. Mesh and mount points.
Vibration fatigue. Lifetime under mechanical cycling is divided into low cycle fatigue (LCF) and high cycle fatigue (HCF). LCF is driven by plastic strain and modeled by Coffin-Manson.
-0.5 < c < -0.7; 1.4 < -1/c > 2 HCF is driven by elastic strain and modeled by Basquin.
-0.05 < b < -0.12; 8 > -1/b > 20
Vibration software implementation. The software uses the finite element results for board level strain in a modified Steinberg-like formula that substitutes the board level strain for deflection and computes cycles to failure. Critical strain for the component is defined by: where ζ is analogous to 0.00022B but modified for strain; c is a component packaging constant (1 to 2.25), and L is component length.
The Miles Equation relates Harmonic vibration to random vibration and must be utilized until the random vibration FEA code is fully tested and released.
where fn = Natural frequency, Q = transmissibility, and ASDinput = Input spectral density in g2/Hz.
Figure 14. Natural frequency displacement.
The reliability software vibration modeling results show the displacement of the PCB at all locations (Figure 15). The results are plotted for each axis of vibration, and the most impacted components are revealed in the component list (Figure 16). Fatigue results are also shown in an unreliability plot over the life of the product, in the case where vibration is an ongoing event.
Figure 15. Graphical vibration results.
Figure 16. Graphical vibration results.
Mechanical Shock Environments
Mechanical shock requirements were initially driven by experiences during shipping and transportation. Shock became of increasing importance with the use of portable electronic devices and is a surprising concern for portable medical devices.
The basic environmental contributing factors include:
Height or G levels.
Surface (e.g., concrete).
Orientation (corner or face; all orientations or worst-case).
Number of drops.
JEDEC shock failure. Failures related to mechanical shock typically cause pad cratering (A,G in the image) and intermetallic fracture (B, F in Figure 17). This is an overstress failure, not a fatigue failure, and follows a random failure distribution.
Figure 18. Shock displacement results for a test board.
The software analyzes shock based on a critical board level strain and will not predict how many drops to failure. Either the design is robust with regard to the expected shock environment, or it is not. Additional work has been initiated to investigate corner staking patterns and material influences. An example of the modeling showing displacement across a CCA after a shock event is shown in Figure 18. The rank order of components experiencing the largest strain is shown in Figure 19.
Figure 19. Components are listed in order of those experiencing the highest strain.
Constant failure rate module. A recent addition to the software has been the inclusion of a constant failure rate model using MIL-HNBK-217F calculations. Inputs necessary to compute failure rates are located in the parts list (Figure 20). The component failure rate is based off the 217F model and takes into account the temperatures at which the product operates. An example of the unreliability failure plot is shown in Figure 21, along with failure rates from solder joint fatigue and vibration.
Figure 20. Failure rate information entry.
The appropriate test conditions can be determined by first generating a solder joint fatigue model based on the expected field conditions of the product. The percent failure at the required life is then known for the design. The model is then rerun using the desired thermal cycle test conditions (say 0° to 100°C). The number of cycles required to generate the same percent failure shown in the previous model is how many cycles are required (with no great percent failure). Naturally, the number of cycles may be increased if the sample size is reduced.
Early in the design phase of a product is the best time to run various what-if scenarios for the design. These might include experimenting to determine where the mount point locations should be in order to reduce strain on sensitive components. One may also run thermal cycling modeling using the various package options available for critical integrated circuits. The impact of changing a product from SnPb to Pb-free solder may also be evaluated.
Some high-reliability products require 100% ESS to ensure no poorly built products escape production. A common ESS test is thermal cycling; however, one does not wish to remove more than 5% of the useful life of the product during the ESS. By modeling the total life, it can be ensured that the number of cycles selected for ESS is appropriate.
Finally, many consumer electronics companies provide a warranty period for their products. Funds must be set aside for each product shipped to cover the expected field returns within the warranty period. It is important that these costs be roughly accurate and based on data, since money is lost if the retained amount is too large or too small. The results provided by the modeling tool can provide a portion of the total expected field returns due to hardware wear-out mechanisms.
Figure 21. Life prediction that combines component failure with PTH and solder fatigue.
Summary
Designing in reliability upfront pays off immensely over the life of the product. To date, there has not been a simple-to-use method of estimating the wear-out life of an electronics product. The reliability software described here is designed to fill this need and does so by permitting rapid assessment of electronics systems reliability using physics of failure (PoF).
References
1. Aberdeen Group, “Printed Circuit Board Design Integrity: The Key to Successful PCB Development,” 2007. 2. Gene Allen and Rick Jarman, Collaborative R&D, John Wiley & Sons, 1999. 3. B. Wunderle and B. Michel, “Progress in Reliability Research in Micro and Nano Region,” Microelectronics and Reliability, vol. 46, no. 9-11, 2006.
Ed.: This article is adapted from a paper from SMTA International 2013 and is reprinted here with permission of the authors.

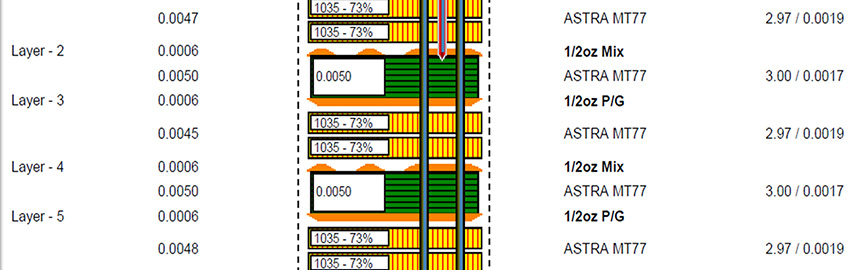
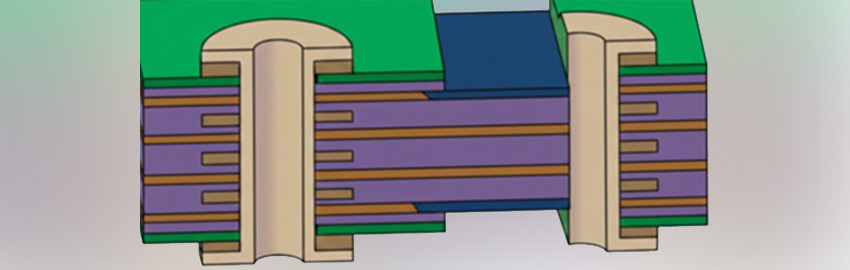


 Figure 1. The EMS should take adders such as manual assembly into the equation.
 Figure 1. Some standards, such as IPC-SM-785, are too old to be inherently valid for today’s use.
 Figure 2. Environmental profiles inserted into software for modeling.
 Figure 3. PCB layer viewer and relevant data.
 Figure 4. Parts list package database editor.
 Figure 5. Laminate manufacturers.
 Figure 6. CAF formation between vias within the PCB.
 Figure 7. PTH fatigue images.
 Figure 8. PTH fatigue life prediction.
 Figure 9. Tabular PTH fatigue life data.
 Figure 10. Predicted thermal cycle results compared with modeling results.
 Figure 11. Solder joint fatigue life prediction (representing a very harsh under hood environment).
 Figure 12. Sherlock results table.
 Figure 13. Mesh and mount points.
 Figure 14. Natural frequency displacement.
 Figure 15. Graphical vibration results.
 Figure 16. Graphical vibration results.
 Figure 17. JESD22-B110A, Subassembly Mechanical Shock.
 Figure 18. Shock displacement results for a test board.
 Figure 19. Components are listed in order of those experiencing the highest strain.
 Figure 20. Failure rate information entry.
 Figure 21. Life prediction that combines component failure with PTH and solder fatigue.
