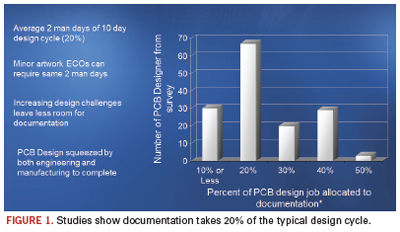
Dedicated tools help reduce the once-manual job by 20% of the typical design cycle time.
The question posted to the DesignerCouncil email forum was simple and straightforward: “Why on earth can’t these companies make a product out of the box that does engineering documentation well? I find it hard to believe there can’t be a boilerplate level delivered that could handle 80 to 90% of most companies’ documentation needs out of the box. … Even the BoM reports delivered out of the box from Oracle are absolutely useless. You need an integration company or an internal team of Oracle experts to spend a fair amount of effort just to get a usable BoM report.”
What’s fascinating, if not somewhat predictable, is how many firms take software that is intended (and good) at one function and repurpose it for something else. Take, for example, two of the best-known product life management tools: Oracle’s PLM and PTC’s Windchill. Good programs, both, but they were never intended to handle circuit board documentation. It’s one reason why it takes, on average, two man-days of the typical 10-day design cycle to complete the documentation (Figure 1).
Best-in-class processes reduce the amount of time spent creating the documentation; are automated so as to create a “living” document, or one that’s not fixed in time, unlike a paper printout of a pdf where, in the event of an engineering change order, the documentation needs to be regenerated; and facilitates product flow to the extent that the end-product quality is enhanced. As Downstream Technologies cofounder Joe Clark says, “Documentation is much bigger than just design, fab and assembly.”
Designers are pros at stretching the limits of CAD tools and other software, but at some point the deficiencies become too glaring to tolerate.
It’s why I’m surprised more haven’t turned to BluePrint, which purports to solve the headaches by providing access to all the electrical intelligence contained in the PCB CAD database to create detailed documentation in reportedly a far shorter timeframe than using traditional ECAD or MCAD tools.
The brainchild of DownStream, BluePrint was developed by former board designers who understand from firsthand experience the pains of their ex-colleagues. It uses a drawing- and sheet-based approach to create actual PCB documents (drill drawing, assembly drawing, parts list, and so on), and stores them in a digital release file. BluePrint uses the CAD data to automatically create unlimited views, details, and charts of the PCB, and can revise the documentation to reflect new PCB changes, reportedly in seconds. It’s not just a tool change; it’s a change in methodology.
Like MCAD, BluePrint can document drafting and dimensional specifications. Where BluePrint separates itself from the traditional MCAD tools, however, is in the number of required translations. Mechanical tools aren’t designed for the specific nature of a printed circuit board. To wit: MCAD cannot distinguish between a layer on a circuit board and a floor of a building. Meanwhile, BluePrint is a full 2-D drafting tool designed specifically to create PCB documentation and capable of creating anything that the CAD, fabrication and assembly departments might need. It eliminates constraints imposed by the PCB design tool for documentation, but retains the intelligence lost when using an MCAD tool for documentation.
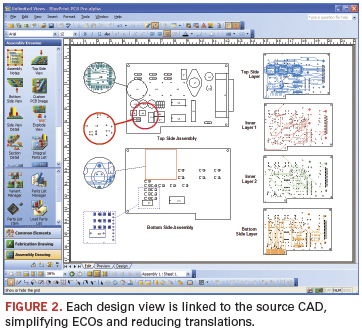
The best example of this is BluePrint’s support of unlimited PCB design views on any drawing sheet. Each instance of the design can be set with different display settings, scaling and formatting. However, each is also linked to the source CAD to automate ECOs, requiring one file translation from the source PCB CAD data to BluePrint (Figure 2).
As our emailer suggested, most users try to generate documentation from their ECAD tool. But ECAD was never intended for that purpose: Dimensioning is the domain of mechanical design. In practice, it’s another story. Asserts Clark, “Users do [documentation] in ECAD because they need to get it onto the piece of paper. There are lots of things done in the electrical design process that have nothing to do with electrical design; it’s all aimed at the documentation.” For instance, the use of assembly variants or mechanical components, which are never simulated but are pushed into a design capture or PCB layout tool to ensure they are represented in the final bill of materials.
BluePrint was developed to work with existing EDA tools. The MS Office environment requires a single load of the entire PCB CAD database to start the documentation process, and uses all the CAD intelligence to help create the documentation. ECOs are added by “refreshing” the source CAD data. BluePrint refreshes the documentation package, adding the new data in every instance of a board view, detail and chart.
“BluePrint brings ECAD design into the documentation tool,” says Clark. There, in the gallery (also known as the library, the term “gallery” is used so as not to be confused with the data for the PCB packages and land patterns), users create a drawing sheet, dragging and dropping the elements onto it. Any element – the number of zones, the font, colors, format, and so on – that is dragged and dropped on a sheet is “intelligent”; links remain active from the underlying design database, so if the links change, everything within the drawing is updated.
Inside the file are contained via stackup and drill layer pairs; drill symbols, patterns and charts; notes and callouts; mechanical component support; parts lists and assembly drawings; tooling, and so on. Schematic, Gerber, DFX, PDFs, plus any graphic or audio files are all stored. Or, in the words of Rick Almeida, DownStream’s cofounder, president and a former designer, “Any data used to create documentation and drive manufacturing.”
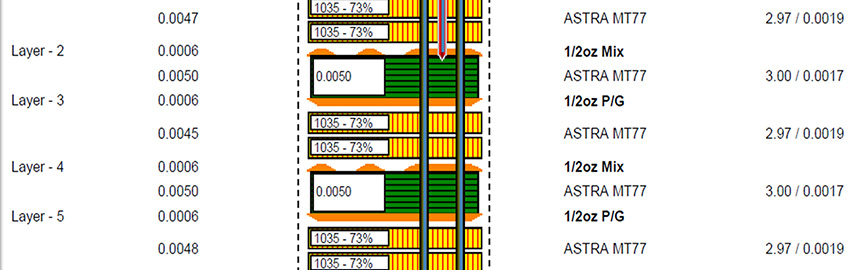
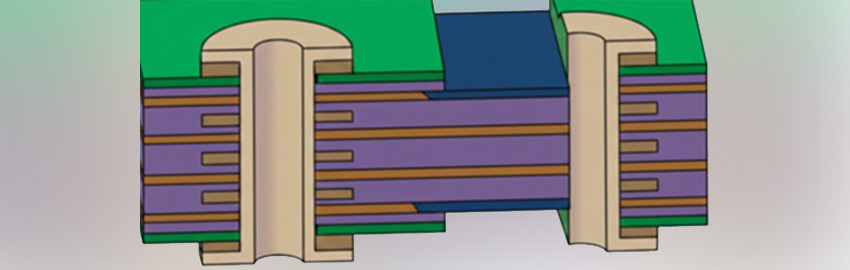
Automation of documentation is created by first creating the graphical “pictorial” of how the user wants to see a specific documentation element, for example, a “Via Stack-Up.” The graphical instruction defines how the via stackup should look. The via stackup could be amended, and the template modified to company-specific versions and saved for reuse. The template graphics are linked to data fields that pull the correct information from the PCB CAD data to intelligently create a via stackup that reflects the design intent and remains linked to the CAD data, so when the CAD data are updated (e.g., new layers or via ranges added or deleted) the detail is also automatically updated. “Essentially we use the same approach that is found in MS Excel chart build, where empirical data are married to user-specific graphics,” says Almeida. This same process goes for drill charts, parts lists, finger chamfers, coordinate lists, exploded views, etc.
BluePrint supports automation of the assembly drawing as well. This includes parts lists, which, even if not shown in the documentation set, are in the underlying design database and can be referenced as needed. The search function can find specific parts and component outlines. What it is not is a bill of materials management tool. “The parts list is a key part of the documentation,” explains Clark. “Documentation affects the parts lists, because as designers do the layout, they add mechanical parts, such as face plates, screws, washers. They need to be able to add to the parts lists and export them to the right department so they can add to the BoM and bring in all the attributes of the parts.” With BluePrint, users can import an external parts list from PLM or other enterprise systems, and sync the parts list with the assembly document, then export the parts list back to the enterprise system for ongoing management.
BluePrint follows the orientation of the board to place component reference designators. (The latter can be hyperlinked, too.) Assembly variants can be created at both the parts list level and also with a graphical assembly pictorial, with special legends to show what’s been installed, uninstalled or substituted. Documents such as relevant standards can be inserted as hyperlinks into the database. It also can generate rework sheets, showing cuts and jumpers, and include installation procedures.
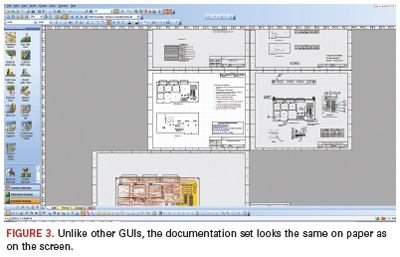
One complaint about reference designators in Oracle and SAP is that they do not display all instances of a particular part number with the part number and description in a single screen or menu. That’s not an issue for BluePrint. The documentation set in the GUI looks just as it will print on paper (Figure 3). The documentation package also can be exported as a pdf and posted to the Web, or as html on a company Intranet.
“It treats the end-product like a PCB, not a generic widget,” Clark says. “We don’t know how good our documentation is until we print it. Then, if something is wrong, we need to go back upstream and fix the ECAD database, then print again. What we do is allow the user to work with the documentation as it will be delivered upon release. This is a full 2-D drafting tool; it’s not intended to replace the mechanical group, but you need to be able to move and place things when doing the documentation. The handcuffs need to be removed.”
As we reported several months ago, Qualcomm has become one of the largest companies yet to standardize on BluePrint. Come this time next year, I would expect many more such announcements – and far fewer plaintive missives like the one at the beginning of this story.
Mike Buetow is editor in chief of PCD&F/CIRCUITS ASSEMBLY; This email address is being protected from spambots. You need JavaScript enabled to view it..
From QFNs to DFNs to MLPs, these packages are cheap, but tricky.
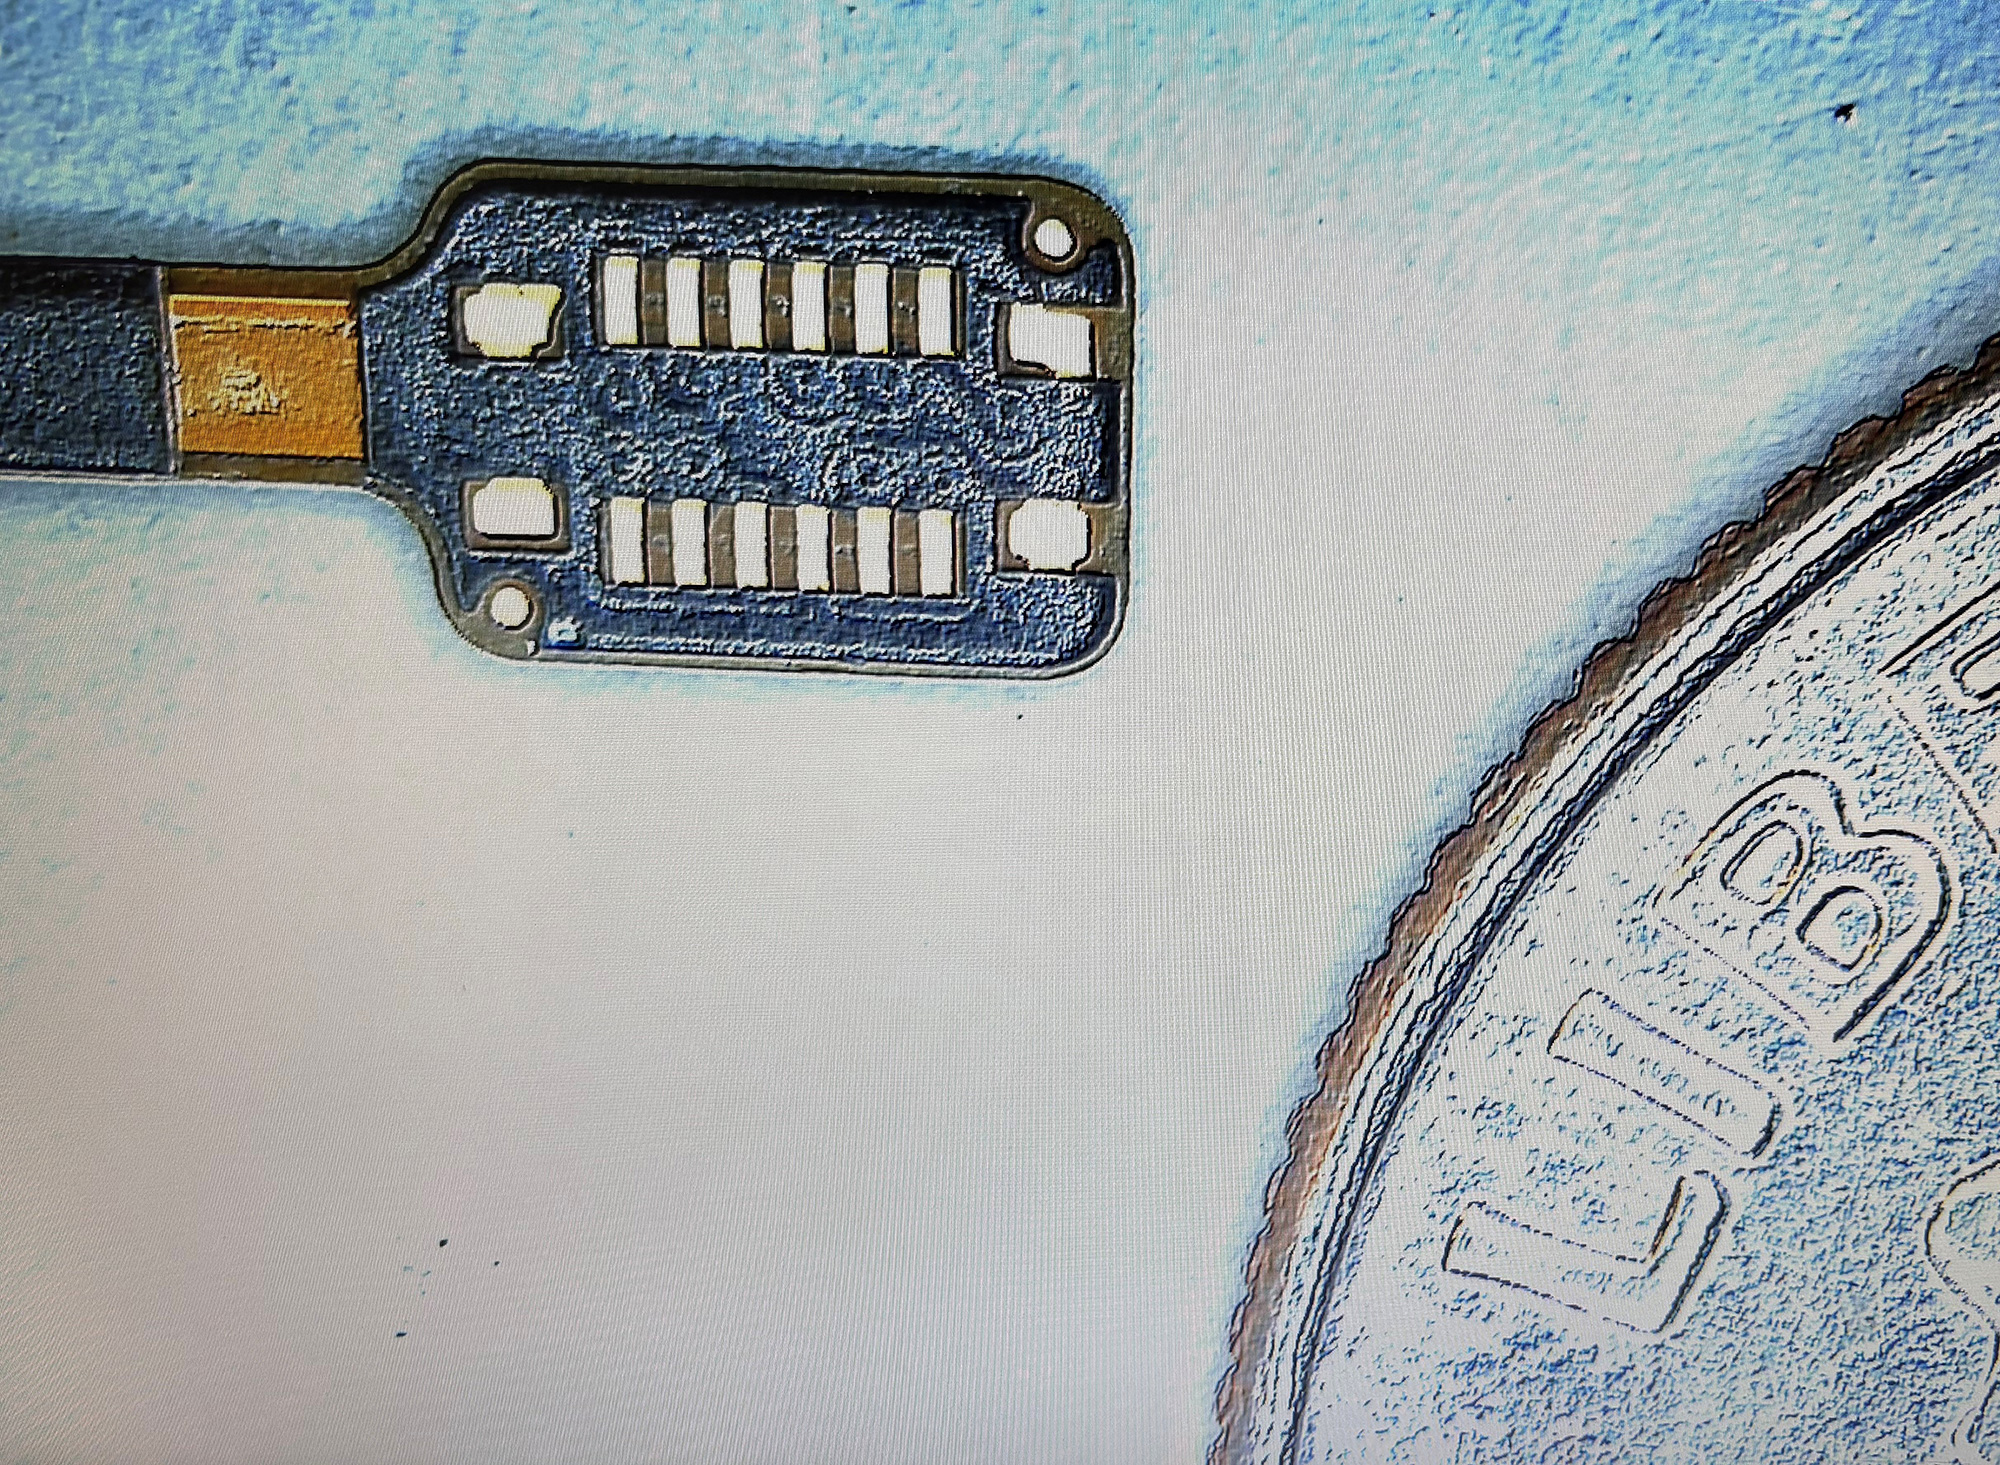
What are bottom termination components? You may not know the term “BTC,” but because IPC is focusing on these packages, expect to hear more about them. IPC has coined the term BTCs for descriptive package names such as QFN, DFN, SON, LGA, MLP, etc. They are in some ways similar to BGAs, which also have hidden terminations, but they are also very different. They do not have balls, but rather, metalized terminations or pads underneath the package.
Most, but not all, BTC packages have a large ground or power termination surrounded by smaller signal terminations. When it comes to inspection, they pose even more challenges than BGAs, which permit inspection by endoscopes. You may not be able to see side solder fillets, and even when you can, they may look non-wetted or dewetted. But, dewetted and non-wetted side fillets in BTCs are acceptable.
BTCs provide good electrical and thermal performance, and they are the cheapest package on the market. However, they do require perfection – not only in the assembly processes, but perfection on the part of the PCB and component suppliers as well, which need to supply flat PCBs and packages.
Guess the chances of getting perfect PCBs and packages: not likely. Through-hole components have been in use for more than half a century, but are still far from perfect, so don’t expect to achieve nirvana when it comes to this latest package trend.
The basic driver for BTCs is cost, which to a cost-competitive industry should come as no surprise. It is a package with the lowest per-pin cost, as low as half a cent per pin. To put this in perspective, if a package costs less than one cent per pin, it is considered a very low cost package. Thus, it is easy to imagine the attraction of this package, especially if the application is high volume such as cellphones or other mobile products.
Designers love this package because there are no leads, making BTCs an excellent choice as a result of their very low resistance and capacitance – also known as parasitic loss. Heat transfer from the package to the PCBs is also excellent, due to their large thermal pad in direct contact with the PCBs.
But there is no room for error. With no leads or balls, they must be perfectly flat, and the PCB must also be flat. How often does that happen?
The only variable the user has is solder thickness paste. However, if too much solder paste is used to compensate for package and PCB warpage, the package will float and may be misaligned. Also, expect excessive voids with too much paste.
If too little solder paste is used, and if there is any warpage in the package or PCB, expect many opens. There are difficult choices to make in the process selection, and inspection doesn’t help, since the end of the visible terminations are bare copper; hence, do not expect them to solder to achieve side fillets.
This is the reason why IPC has stepped in to help the industry develop a design and assembly guideline for BTCs. This author co-chaired IPC-7093, Design and Assembly Process Implementation for Bottom Termination SMT Components. The document describes the design and assembly challenges for implementing bottom termination surface mount components whose external connections consist of metalized terminations that are an integral part of the component body. The focus is on critical design, assembly, inspection, repair, and reliability issues associated with BTCs.
The target audiences are managers, design and process engineers, and operators and technicians who deal with the electronic design, assembly, inspection, and repair processes. The intent is to provide useful and practical information to those companies using or considering SnPb, Pb-free or other forms of interconnection processes for assembly of BTC-type components.
This document, although not a complete recipe, identifies many of the characteristics that influence the successful implementation of robust and reliable assembly processes, and provides guidance to component suppliers regarding issues being faced in the assembly process.
The exchange of information between the component supplier, product design, and assembly personnel about those parameters that influence good assembly practices is more critical with BTC implementation than with any other surface mount part.
During IPC Apex this year, committee members voted to accept the document pending minor revisions and final editing at a meeting to be held Aug. 31. We hope to complete deliberations Sept. 2, and plan to publish the document by the end of September.
Ray Prasad is author of Surface Mount Technology: Principles and Practice, and founder of the Ray Prasad Consultancy Group; This email address is being protected from spambots. You need JavaScript enabled to view it.. He will teach SMT-BGA-BTC Design and Manufacturing and Lead-free Implementation courses in Portland Oct. 11 to 13.
Simply recreating the PCB information adds steps, but little else.
Assigning I/O pins has transgressed well beyond a sketch or spreadsheet, and routing these large devices requires collaboration between FPGA and PCB designers. With modern I/O routing tools, savings can be realized in layer count, trace length (and consequential signal integrity improvement), and via use.
A good starting point is automation of symbol creation and PCB schematic connectivity to streamline the FPGA pin assignment process. Designers need to proceed with caution and investigate how such automation tools affect the complete product design flow. For example, an approximate recreation of the PCB information for use by an FPGA I/O assignment tool simply adds another step and another representation of the data – without fostering design convergence. Tools that create a unique set of product-specific symbol fractures for each FPGA design should be weighed against the company’s reuse and library management goals. Recreation of an entire local symbol and schematic set with each iterated pin change can make design a data management nightmare.
Instead, an FPGA/PCB optimization process that is the same from project-to-project focuses on a centralized library structure that promotes common practices among designs, as well as design reuse. Setting up this corporate “generic” environment that creates a true FPGA/PCB symbol theme has many downstream benefits, and also allows pin reassignments to be instantly communicated in a “push-button” fashion to all members of the design team.
At the librarian level, initially all symbol fractures for an FPGA are automatically generated, tied to the physical cell and part number, installed into a centralized library, approved, and made available for all users of the FPGA. FPGA power, ground, and config pins essential to the FPGA are optimally defined by the librarian, allowing functional designers to focus efforts on optimizing the I/O pins specific to the design. This approach not only fosters reuse, but avoids further design-specific regeneration of the symbol set for each iteration.
The upfront library configuration pays off not only in reusability, but also the ease through which pin iteration steps are completed. When a pin assignment change is made to the FPGA in the board context through the FPGA optimization tool, schematics containing the symbol set for the FPGA are updated with new connectivity information, and the centralized symbols themselves remain unchanged. This ease of iteration lessens the impact of design changes late in the design cycle.
To close the design loop, optimized pinouts are written and conveyed back in the FPGA vendor’s constraints file format – where the flow was initiated – as the signal names for the functional schematic, and initial pin assignments were obtained from the HDL and constraints file. Vendor I/O rules are followed throughout the process in the I/O optimization tool to adhere to DRCs for drive strength limits, VREF, I/O banking restrictions, LVDS proximity restrictions, differential pair recognition, and allowable I/O standard settings per pin. Vendor rules must be accurate and up-to-date and require close cooperation with suppliers to gain access to new architectures and package types.
From a physical implementation standpoint, comprehensive FPGA-to-PCB optimization requires further insight into the physical BGA implementation to be truly effective. Algorithms that unravel the pin connections on the FPGA to other components in the PCB context need to consider if BGA breakout and escape pre-routes have been utilized, as these effectively change the pin ordering. In the I/O optimization tool, unraveling the rats-nest connection to the escape trace endpoints provides shorter trace lengths, fewer PCB vias, and a more routable PCB than unraveling only to the pins.
Analyzing the entire design process may show that some solutions end up adding time and effort to the current project, or because the designs cannot be readily reused, future designs do not benefit as much. Optimization of connectivity meeting both FPGA and PCB design constraints requires tools that are PCB- and FPGA-aware (as well as BGA-aware), promote FPGA–PCB design concurrency while instituting repeatable processes, and have centralized reusable device representations.
Frank Smetana is market development manager at Mentor Graphics (mentor.com); This email address is being protected from spambots. You need JavaScript enabled to view it..
Every month between publication cycles, I try to reach out to designers to find out how things are going, what they working on, and of course, to find out if anybody has acquired any cool new guitars. Last week I talked to a friend (my twin brother of a different mother) many readers may know: Kelly Dack. Kelly works for IGT in Reno, NV. Not only does Kelly get to enjoy working and living in one of the most fantastic areas of the US, he and his colleagues at ITG get to work on some interesting boards. Those colorful and musical machines you see at any casino? ITG designs and builds them. If you’ve been to a casino lately, you may have noticed the flashing and pulsing lights that accompany the siren songs are changing. They are migrating to LED technology. According to Kelly, even the enticing sign that welcomes people to Reno is now lit by LEDs.
To people like me who have retired from daily board designing, LEDs were always a small part of our designs. They were employed to alert you whether the computer was on, or the car engine needed an oil change or something like that. Today, LEDs are at the heart of a dramatic change in energy conservation. They are no longer the little “ON” lights: They are the illumination for everything. Kelly and others have told me about boards chock full of LEDs. But there are issues with these boards with which more designers are going to have to contend and find answers.
From what I hear, a big issue right now is thermal management. When you put a bunch of LEDs on a single board, the heat buildup can be so significant as to cause failures. Some people are using heat sinks, bus bars and fans, of course. But going forward there will have to be better solutions. Metal core boards may be one answer, but other creative solutions are going to be required. I’ve heard that people are experimenting with cutouts in the substrate to get more direct contact with a metal core.
Another problem is one of capability and capacity on the manufacturing side. As reported by Mike Buetow, our manufacturing and business guru, only 15% to 20% of the EMS companies have production experience with metal core boards. As we all know, it does no good to design “it” if “it” can’t be manufactured at a reasonable cost and delivery. And then there is the issue of component traceability. Different LEDs have different light-emitting properties that are denoted by a “bin” code. Bin codes might be mixed on a board to get the right amount of light out. As such, assemblers have to track (scan) by serial number the LEDs on each board to ensure the end-product is to specification. They can’t simply swap one part for another, making tracking more complicated than with traditional passives.
It’s always interesting to see a new technology, or technology used in a new way. It’s one of the things that keep our jobs challenging. Expect to see more about the design and manufacture of LED boards in upcoming issues of this magazine and on our websites. In fact, for the first time, we have a class on LED board technology at PCB West (pcbwest.com) this year.
Speaking of PCB West (a somewhat transparent segue to set up a blatant plug), things are starting to heat up. As I write this, in early August, we are about seven weeks away from the annual trade show. Our VP of sales and marketing, Frances Stewart (known to some as She Who Must Be Obeyed), tells me that the show floor is just about sold out, and she is determined it will be full by the time we see you at the show. Registration is tracking ahead of this time last year, and we are looking forward to talking with a lot of people we haven’t seen in a while.
Space doesn’t allow me to list all the classes, but I do want to call your attention to a session on Wednesday called Designers’ Roundtable. This will be a somewhat free-form networking session to find out what designers are struggling with and share some ideas. We tried the Designers’ Roundtable at PCB Atlanta last year and the response was fantastic. According to designers and fabricators here in the Atlanta area, there is still a desire to have a better networking solution for designers. For whatever reason, most local Designers Council chapters haven’t met in some time. (I hear the same comments from a lot of local chapters.) I’d like to hear your comments about this at the roundtable and will be glad to share some of our thoughts as well.
In the meantime, stay in touch.
Pete Waddell is design technical editor of PCD&F; This email address is being protected from spambots. You need JavaScript enabled to view it..
Optimal cost management means material prepped for production needs real-time monitoring on the factory floor.
Manufacturers deploy various manufacturing systems that provide necessary controls, enable data collection, support cost-saving initiatives, provide a means for compliance, and help decrease time to market. Yet most remain as islands of information, and provide the value intrinsic within their own confined systems. How can real-time material management manage costs and improve inventory turns? What are the benefits of having a quality system talk to a traceability and material management system? Can we optimize overall equipment effectiveness by enhancing links between material flow, quality and surface mount technology programming, and monitoring data? How can we increase revenue?
The typical organization likely has purchased and deployed various manufacturing systems, either based on customer requirements or internal process improvement initiatives. Those systems have been painfully deployed, causing all kinds of havoc to existing operating processes and risks to quality. Now that the tough deployment is done, and systems seem to be running fine, how is this leveraged to improve business? Can the organization better compete in the EMS manufacturing world using these manufacturing systems?
Let’s review the systems typically deployed at EMS and vertically integrated manufacturing companies. A quality management system (QMS) ensures that product quality is collected and monitored through the assembly process. At key inspection points in the factory, operators visually review a board, scan or enter board identifiers (serial numbers or barcodes), and a defect code that reflects the issue with that board. Those data are collected for each board and pushed into a database for mining later. The value of those data depends on the capabilities and limitations of the solution, the creativity of the team, and how those data are mined. Good business intelligence solutions are most effective at this point, and should not be confused with manufacturing intelligence (focus on overall manufacturing visibility of key aggregated data/metrics for upper management).
The main goals of QMS are yield rates (first pass, order, absolute); defects per million opportunities (DPMO); DPM per assembly, order, and functional area on the production floor; storing historical data for trend analysis and post-mortem root cause analysis; ensuring on-time shipments (no production stops due to rework); performing preventative and corrective actions; maintaining and ensuring conformance and compliance, and providing statistics for OEE.
Manufacturing operations management (MOM) systems control and ensure boards move in a predefined path on the factory floor and at each of these locations. Board information is recorded to ensure work in process is registered and monitored. A shop-floor system answers the following questions: Was the correct SMT line used? Was it handed off to the right manual insertion line or stations? How many boards of a specific work order are in test or final QA? How long did it take? How much inventory was used, and when? Did the product go down a RoHS-compliant line?
Some systems also include traceability. Which part numbers are placed on a board is added to the information and used to create a build record for that order and/or assembly.
Enterprise resource planning systems are complex systems that handle purchasing, order management and planning functionality within manufacturing companies. The ERP provides the information on what needs to be built (work order), the quantity to be built, and the parts to use (bill of materials, company-specific part numbered lists). ERP systems also manage available inventory to ensure the correct amount purchased, and, at production order completion, that the customer is shipped to, invoiced or billed.
You’ve implemented a QMS, an ERP and even a shop-floor system or full MOM. Now what?
Interoperating to Manage Cost
Cost management is tied to factory management. Key cost contributors in most factories include material use, rework, returns and overstock.
Interoperating systems that “talk to each other” help manage costs. The largest variable cost in manufacturing is the material. Purchsed raw material (components) sitting in stock depreciates in value. Material sitting on the factory floor costs money and goes into a void, where only regular inventory counts, or manual material counts, bring them back into view – typically, too late to make any adjustments before diminishing inventory turns.
You can completely eliminate the problem of material shortages on the production floor. What if you knew exactly how much material is needed? The average factory sees about five material shortages per line per week, according to a study by the Aberdeen Group (Table 1). While that material is being pulled, production is stopped, adding to the opportunity cost.
To truly achieve cost management, material pulled out of stock, kitted and prepared for production, needs to be monitored real-time on the factory floor. As feeder errors, nozzle rejects, and drops add to the consumption of the material issued, the stock room needs to be alerted and advised of materials needed (like part numbers), and the stock and delivery location (line and machine).
Only if an SMT monitoring system is interoperating with a material management solution in real-time (which polls the consumption and generates these material pull instructions) can this be achieved. Knowing that a part will be out is not enough. An alert when material is out in a machine or feeder provides no additional value. In most cases, that’s the status quo. If the monitoring system provides low-level warnings that a part will be out after five or 10 additional boards, then we truly can react in time to provide material: This is a predictive solution.
Material management is complex and essential, with several factors to consider. Material availability rules can be modeled in a cost methodology. It may be more expensive to pull some parts from stock over others. Pulling inventory should be done using a first-in-first-out approach, so oldest parts are pulled first; older parts are cheaper. Inventory issued to production that sits in floor stock is cheaper than inventory in a main warehouse. Moisture-sensitive parts sitting in dry ovens or dry storage locations must be considered. If they are not ready to be pulled from storage, they are not available. This costing model must be part of the material management system, interoperable with the SMT monitoring system to effectively pull the right parts to the right locations just in time.
How best to execute this process of costing? Will the warehouse or material handlers know what to do, when and to where? A communication mechanism must be created to eliminate errors and maintain process quality. The material management system should poll the SMT monitoring system at regular intervals and generate a picklist. Polling can be configured based on production rates, production line size and the frequency of expected material requirements, so the consumption data are queried and a picklist is generated when needed. This picklist will alert the material handler to pull the appropriate material from their stock locations (production floor stock, raw material warehouse, etc.) by generating a barcoded or paper picklist used to fullfill the order.
Once material is ordered, it is routed to the production floor for use. For high-volume continuous production, picklists and material arrivals can be done at regular intervals to ensure production lines are never starved for material. Production stoppage due to material shortage is no longer an issue.
For vertically integrated manufacturers or EMS companies that produce high-mix with high volume, the challenge is to ensure material is ready and constantly available, and between work orders (with 75% similarity in parts), plus minimize the changover downtime.
Changeover is the process of preparing an assembly line for a new production order. In most cases, this means changing conveyors, NC programs, documentation, active order selection and material. Typically, variant products are built on the same line so they can avoid changing the conveyors, thus replacing only the materials and programs associated. However, this poses a new problem: how to change all the materials (feeders, reels, bins, trays) efficiently. The answer: interoperability between material management and SMT monitoring.
The SMT monitoring system (machine vendor or third-party) has knowledge of part number location (or where they need to be located), and at which slot/feeder on the machine. It contains the program information, which program is active, and defines which one is next. Knowing this and pulling the information ordered by the picklist generator, changeover instructions can be created easily. The only way to ensure the right changeover instruction is generated is by using the actuals on the machines (Figure 1), rather than planned by engineering.
Real-time changes happen all the time in factories. To achieve efficient changeover, correct material must be available, and only the changes should be done; excess material or time spent is waste.
Knowing where all material is at any time increases productivity and cost efficiencies. Pulling material as it is needed, and not over-pulling, adds additional efficiency into the process. Reduction of WIP and faster material movement increase productivity and inventory turns. This focuses manpower on productive tasks, further managing costs.
Managing Rework and Quality
After implementing the material manager solution, the material handling, inventory and changeover efficiency issues are handled. But there are other places where costs are hidden: quality returns and rework. Rejected boards from in-circuit testers, flying problem testers, functional test units, even manual inpection stations: All need further troubleshooting and fixing. If an unexpected rework has been identified, and the volume increases, it puts stress on the whole ecosystem. Are there enough replacement components to rework those boards? Is certified manpower available to perform that rework? Will we hit the due date for that customer order?
QMS should be able to alert management if accceptable quality levels are not met in real-time. It is too late if AQL breaches are found in post-mortem analysis. Alerts should be set up as escalation of notifications for many of the following: the number of repair loops met (e.g., three test and repair loops maximum per board); AQL; first-pass yield percentage; consecutive failure of the same type.
If QMS and material manager are interoperating, evaluating the inventory of the required components and pulling the required material to the rework stations as needed can be done. In post-mortem analysis, if the QMS identifies a high failure or defect count on a specific component location on an assembly, that information can be tied to the material manager to find the specific vendor, part number, and lot for additional supply-chain quality analysis.
Using the QMS and material manager to identify quality problems during production is the most efficient way of managing costs before the costs occur.
Overall equipment effectiveness is determined by the availability, performance and quality percentage parameters. As material is delivered to production equipment and stations as needed, the performance metric is greatly improved due to the lack of stoppage from starvation. As QMS interoperates with SMT monitoring and shop-floor systems, quality defects found in inspection stations (automated and manual) can be traced back to their source assembly machines, and further analysis of the root causes can be performed. Some examples of these include nozzle problems, high feeder errors or machine uptime issues.
Most manufacturing plants have deployed manufacturing systems. When those manufacturing systems talk to each other, much higher value can be realized. If a completely integrated manufacturing system solution is available, the benefits described of managing costs and improving customer satisfaction can be realized out of the box.
Jay Gorajia is the support manager for the Mentor Graphics Valor Division; This email address is being protected from spambots. You need JavaScript enabled to view it..
Why common metrics fail to root out the causes, and actually add cost in the process.
Many companies adopt a reactive approach to measuring the cost of (poor) quality that focuses on defects and nonconformities. Most companies measure scrap, rework and customer returns, and often “fix” the problem through increased inspection or process adjustments. However, those fixes often fail to eliminate the root cause of the problem.
We try to take a more proactive approach by educating customers on ways to reduce the cost of poor quality through upfront planning. This month, we look at the top five areas where a proactive approach saves money and capitalizes on the efficiencies inherent in a Lean manufacturing philosophy.
1. Failure to adopt DfM recommendations. Lean manufacturing is most efficient when consistent processes are in place. Comprehensive DfM guidelines are part of ensuring repeatable, consistent processes. Optimizing designs for Lean manufacturing requires designers to balance goals for functionality, material cost and long-term product enhancement flexibility against throughput cost and logistics efficiency.
Poor pad geometry and component layout location contribute most to poor quality. In addition to increasing the potential defects, poorly designed PCBs add processing cost.
For example, improperly sized through-hole pads and holes will result in unacceptable solder joints, which drive added inspection and touchup. Lack of fiducials, improperly placed fiducials, or fiducials in the wrong shape or size affect the accuracy of SMT component placement.
Incorrect orientation of bottom-side SMT components can increase the frequency of opens and shorts, resulting in a reduction of quality and increased inspection and touchup. Incorrect SMT land patterns can cause opens, shorts, tombstoning, etc., resulting in a reduction in quality and added inspection.
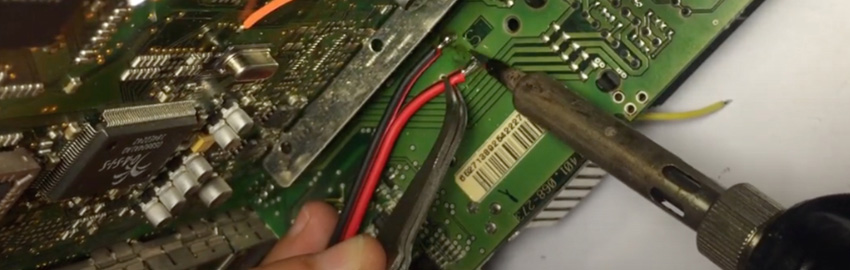
2. Design that drives manual processing. Hand insertion vs. automatic placement triples the labor cost. Hand soldering vs. wave or reflow soldering results in triple the cost of automated soldering multiplied by the number of leads being hand soldered.
3. Component selection. Component sourcing decisions can impact quality, process efficiency, schedule flexibility and product delivery. Consider materials compatibility, thermal characteristics and the component’s ability to anticipate heat cycles, availability and supplier quality track record.
Sole sourcing components adds additional complexity and potential cost, since it limits options in the event of quality or availability issues. When a Lean manufacturing process is involved, another consideration is whether the component supplier will support Lean supply chain principles.
4. Design for test and testability. Lean test strategies often use standardized test platforms. Efficient in-circuit test requires a PCB designed to industry standards and with good access points. And, a robust test process can detect both workmanship and non-process-related defects. According to an Agilent study, analysis of manufacturing defect root causes suggests 10-15% of defects are actually attributable to nonfunctioning parts or defective materials, rather than being assembly process related. EPIC has seen similar statistics in its internal defects analysis.
Test point access also can be a significant cost driver. If a design doesn’t have test point access sufficient to permit automated ICT, AOI or x-ray inspection or flying probe test are higher-cost alternatives. Those tools have longer test times, are less effective in testing the product, and require greater operator interface time. Custom functional test systems alone may not provide as robust a test process and typically increase test time and overall test cost.
Functional test is another area. In many cases, customers consign less-than-optimal functional testers. Inefficiencies inherent in a poorly designed functional tester are only part of the potential cost driver. Maintaining multiple unique customer-supplied testers carries a cost. When possible, use a standardized proprietary functional test platform. When customers insist on using a poorly designed functional tester, provide a report on risks and added cost.
Stress and strain are also potential areas of concern. Design an assembly process that minimizes the potential for overstressing PCBs and a robust testing process to catch issues that may arise in this area.
5. Test correlation. With typical product cost models, it is not realistic to say that zero defects are consistently attainable. Achieving near “zero” levels attainable in a robust process requires detailed upfront planning to ensure all variables and controls are well-defined, implemented and monitored.
Test correlation between a contractor and its customers’ testing can be a challenge. The amount of non-value-added activities surrounding differences in test coverage from contractor to customer is huge when this issue is not addressed proactively. Although full test correlation is not always attainable because customers may be running tests they choose not to outsource, based on time considerations such as burn-in, all other elements of test correlation should be considered.
The key to driving down cost and eliminating costs of poor quality is all based on one thing: the contractor’s and customer’s willingness to truly work together and plan for success. The more robust the front-end planning, the more robust the process and overall product quality.
Tony Bellito is quality/product engineering manager at Epic Technologies (epictech.com). He can be reached at This email address is being protected from spambots. You need JavaScript enabled to view it..