Rapid supply base changes threaten industry stability.
Is there anybody out there? Maybe it’s a sign of aging, or possibly paranoia setting in, but I find myself asking that question more and more.
And anybody is not just anybody. As I look around the industry, the anybody of yesterday is not the anybody of today – or tomorrow.
In years past, when I asked the question, the “anybody” I was referring to was competitors. Over the past dozen years, so many companies, especially in North America, have vanished. Many were proud icons of the industry. Some were fast-moving Tier 1 “players,” and many were the local companies that quietly made up the industry. Regardless of size, stature or location, the industry has fewer of those anybodies.
Today, my focus is quite different. Now I am looking at the shrinking supply base. Many companies are shrinking, if not going away. The risk is becoming a garden with no water or fertilizer. At some point, without those things that sustain life, the plants perish. Yes, companies still can purchase laminate, mask, chemicals – all the supplies that keep factories humming. On the surface, the answer appears to be, “Yes, anybody is out there.”
But look a bit closer and the picture is not quite so bright.
Many suppliers over the past decade have cut back on field sales and tech support – cut enough where, for many, support is nonexistent. The big guys may not be feeling it, but then again, most in North America are not big guys. Worse, when a big guy consolidates, the supply base tends to make further cuts, stretching even thinner the scarce customer support resources. Yes, on the surface, suppliers still offer “world-class” sales and tech support. But if there isn’t anybody available to show up when needed, then “world-class” does not work.
Many suppliers have cut their lines or products. The rational is if the market is not large enough to support a specific item, then it no longer makes “economic” sense to support that product. However, if North America has morphed into a geographic market made up of niche players, then by definition low-volume consumption of specialty products is what is needed to support that niche market. Cut those low-volume lines and the niche players perish. Over the past year alone, our company has received several “announcements” of discontinued or reformulated lines due to low volume, putting considerable pressure on finding satisfactory replacements – usually in days rather than via a controlled phase-out. That process is bad enough on a good day, but when suppliers and potential suppliers have virtually no tech support to provide needed information, the probability of success drops dramatically.
Some suppliers really have vanished. In some cases, distributors have abandoned our industry to focus on larger or more lucrative markets. In some cases, consolidation has reduced players. For whatever reasons, however, the number of vendors seems to have dropped. I say “seems” because, in some cases, it depends on where you do business. For those outside Asia, the numbers have dropped. Walk a trade show in China, however, and you see many companies active in the Asian markets that do not (and might never) sell to the West. These companies may (or may not) have a better product, but most likely do have a better price point. In many ways those unknown companies are more mirage than real, especially when they are not in your country and you don’t speak their language.
So I keep asking myself, “Is anybody out there?” and wonder, “If not, what is one to do?”
Maybe it’s we, the customer, who needs to go to them – to remind them we are still in business, still purchasing and still relying on a solid, committed supply base. When you can speak with a sales or tech support person, often you hear some comment like “headquarters does not think there is a market for ….” In short, the powers that be, too often pencil-pushers, don’t understand the implications of their decisions on individual companies or an industry. I’m not saying they are all that way, and not trying to paint a picture of “us” vs. “them,” but possibly we, the customer, are assuming that some suppliers have lost touch with their customers.
Maybe fabricators should band together and pick one week to visit their major suppliers’ top executives and remind them of their importance in supporting our industry in all geographic regions, large and small. Maybe senior management needs to understand that dropping a product can have devastating implications for the fabricator, end-customer and their own reputation. Maybe we need to remind some suppliers that when a designer chooses a laminate – and then finds it is no longer available – the likelihood that that company’s laminate will be chosen the next time is dramatically reduced.
I do think, however, the burden to remind the supply base of the needs, requirements and value of printed circuit board fabricators is now, more than ever, the responsibility of each individual company, especially the niche firms. And the message has to be that while the numbers and relative size of remaining companies have shrunk in Western markets, their relative importance has not. That message has to be communicated continuously to everyone with a stake in providing materials and supplies.
Is anybody out there? Does anybody care? I’d like to think that the answer to both questions is “yes.”
Peter Bigelow is president and CEO of IMI (imipcb.com); This email address is being protected from spambots. You need JavaScript enabled to view it.. His column appears monthly.
What happens when the “world’s workshop” runs out of workers?
Ask someone in our industry, or any industry, for a short slogan describing the Chinese manufacturing juggernaut and you might hear phrases like immense capacity, unfair monetary practices, government-supported, environmental concerns, unfair trade practices, or a host of other admittedly pro-Western sentiments. But I never thought I would live to hear the term labor shortage used about China.
How could a land of well over one billion people lack the workers to fill positions in its manufacturing sector? Because it appears that is exactly what is happening.
I just returned from Taiwan and China and was surprised to hear from every customer, vendor and supplier that the local labor shortage is putting pressure on almost every sector of the Chinese manufacturing landscape. At the beginning of my trip, I had a single purpose for each firm that I visited. But after hearing about this issue during my first stop, I made a point of focusing on it with each successive visit to areas in Hong Kong (or more specifically, Guangdong Province), Suzhou, Shanghai and other locales.
For the past decade or so, business conditions in China have closely resembled those of mid 18th century America. Most US businesses at that time were located along the coastal regions of the Northeast. Close proximity to waterways helped early American businesses quickly move products from factories to a wide range of customer locations. It took many years for sufficient infrastructure to develop so that business could move into the interior states and still have economically feasible ways of getting newly created product to market. As business moved inward, population shifts began to occur as people followed jobs and commerce westward.
In China, commercial development was also a coastal phenomenon, beginning on a large scale in the areas between Hong Kong/Kowloon and continuing up the coast to Shanghai.
A major difference, however, between the early US and Chinese models is where the labor force originated. In China, prior to the great move toward capitalism, most people lived in rural areas. (Hong Kong, before it was turned over to China by the British, is the exception.) But then many Chinese people left their farms and home provinces and moved to urban areas in search of better jobs and a better life. The Chinese businesses in the coastal cities had a plentiful and ever-growing labor supply.
But whereas in the US, part of the labor force located on the coast moved inland with businesses and then established permanent communities there that spanned generations, many urban Chinese still considered their traditional rural provinces “home.” And now that manufacturing is exploding across China, thousands of companies are setting up shop inland, where the infrastructure is in place to permit efficient movement of product, and province-to-province mobility – once restricted by law – is being eased.
With the home provinces now offering a plethora of employment opportunities, a great exodus of people who moved to the coast searching employment are now looking homeward for a similar position closer to family and friends.
As with all good ideas, once the word gets out, many people will try the same thing. The difference is that in China, the effect is multiplied a thousand-fold.
I have been told the exodus began first in the Greater Shanghai region, then moved down the coast to Hong Kong. The Chinese New Year gave many people a perfect opportunity to make the move as part of the holiday’s custom of returning to one’s birthplace. Thus, a labor shortage that no one would have predicted just a few years ago has suddenly taken hold.
I heard about this problem from those involved in the PCB industry, but could easily envision this phenomenon spreading to other industries as well. The customers and vendors I queried estimated that between 800,000 and 1.3 million people have abruptly left their jobs and moved from the coastal areas. This has created a huge vacuum in some businesses in the affected areas. Trained workers are now in short supply, and the hiring pool has shrunk to a level not seen before.
One might think that replacing workers in China would be easy. Not so. One of my customers ran a job ad for workers for a month and received only one response. This applicant was quickly hired, but left soon after as another, slightly better position opened up. All the people I spoke with expect the labor issue to ease at some point, but because of the enormity of the issue, none would estimate when things would get better. In other words, no quick fixes are on the horizon. Workers will need to be hired, trained and paid well enough to prevent them from moving to competing employers.
One reaction to this problem has been to send a lot of PCB manufacturing back to Taiwan. This influx of work has created a logjam in Taiwanese board houses and is creating a laminate shortage as everyone scrambles for material to manage the increased load. This is not a sustainable solution.
I didn’t think much could surprise me in this industry, but a labor shortage in China did come as a shock. Given the current dismal employment picture in the US, we may well wish we had China’s problem. But a labor shortage there is likely to affect a wide range of Western industries dependent on Asian manufacturing capabilities, just when our own much anticipated recovery is underway. It’s a trend worth watching.
Tom Coghlan is operations director at Bare Board Group Inc. (bareboard.com); This email address is being protected from spambots. You need JavaScript enabled to view it..
Changes to the design by non-designers usually result in unforeseen failures.
A February article by Jack Olson and Mike Tucker titled “PCB Data Preparation” (http://pcdandf.com/cms/magazine/209/6996) spurred me to elaborate on a few items from the designer’s perspective.
It is true that often a designer does not want the fabricator to modify the PCB data file. We have a note similar to the one mentioned in the article:
DATA MAY NOT BE MODIFIED WITHOUT WRITTEN APPROVAL
I believe our version is a little more practical. We call it Note 23. We put it on every PCB print, always as Note 23. Note 23 reads as follows:
MODIFICATION TO COPPER WITHIN THE PCB OUTLINE IS NOT ALLOWED WITHOUT WRITTEN PERMISSION FROM MOREY ENGINEERING, EXCEPT WHERE NOTED OTHERWISE ON PRINT. MANUFACTUER MAY MAKE ADJUSTMENTS TO COMPENSATE FOR MANUFACTURING PROCESS, BUT THE FINAL PCB IS REQUIRED TO REFLECT THE ASSOCIATED GERBER FILE DESIGN +/-0.001 IN. FOR ETCHED FEATURES WITHIN THE PCB OUTLINE.
This makes it clear to the fabricator that it can smooth geometry, perform edge compensation, etc., to make the fabrication process reliable. It is also clear that the designer requires the copper in the final product to match the Gerber files.
The real motivation behind Note 23 is simple: to send any given PCB design to more than one fabricator and get the same result. Most companies probably always fabricate the PCB for a given project with the same fabricator for consistency, but what happens if the fabricator goes out of business or is purchased by a competitor, or begins having quality issues? You may be forced to change your PCB fabricator, a messy business for many reasons. It’s even worse when boards from a different fabricator do not function the same way. If the fabricator follows the designer’s print and the PCB does not function properly, the responsibility lies with the designer for not having a complete and accurate description of their own design.
How can you verify you actually get what you asked for? It is true, as Olson and Tucker mention, that a designer should establish a good relationship with their PCB fabricator, which includes working to communicate one’s own needs and process, and to understand the fabricator’s needs and process. Note 23 is another step in the right direction. If the fabricator finds an error, the last thing you as the designer want them to do is to fix it without telling you. Given the chance to fix the problem, the designer will eliminate the possibility that another fabricator fixes the problem differently (resulting in a different final PCB) or, worse, fails to identify the problem and builds nonfunctional PCBs.
Another move is to work with the board fabricator to get it to provide individual layers of the PCB any time it changes the fabrication files. What would you do with individual layers? From experience, I can say that most of the time, if everything goes well, they will collect dust. If you do need them, however, you will not be able to get them after the fact.
Individual layers permit observation of differences in the copper in the PCB from different fabricators or from one design revision to the next. Let’s say the customer is having field failures and cannot determine the problem. It will go to its contract manufacturer for proof of the integrity of every component in their product.
Generally for the PCB, all the EMS firm can do is provide the first-article inspection (a piece of paper), and cross-section the PCB and verify the layer stackup, neither of which can reveal whether the copper on each layer inside the board was fabricated per the design. From a contract manufacturer’s perspective, the individual PCB layers can help the customer determine if the board was fabricated per its design.
Another big tradeoff is controlled impedance versus designed impedance. Controlled impedance is the practice of specifying specific traces on a PCB must be a certain impedance, and leaving it to the fabricator to adjust the design as necessary to get the specified result. (The adjustment typically includes trace widths and PCB material thicknesses.) Designed impedance is when the designer specifies the PCB stackup and trace widths to get the desired impedance.
As an engineer, controlled impedance can be scary. You have given control of critical PCB parameters to the fabricator. The fabricator could change the manufacturing parameters on the fly without notification based on its currently available material. The advantage is that you (could) receive a lower price, but at the cost of losing control over the design. This could be OK, provided the design is simple and can permit this variation. Complex designs usually mean less design headroom and lower tolerance for change.
Let’s say you have a design that incorporates several fine-pitch BGAs connected by an address/data bus that requires impedance A, and you have a few RF traces that require impedance B that route to antennae fabricated right on the PCB. The PCB complexity is now at six to eight layers, and the designer has the option to specify each “important” trace on the PCB and its impedance (controlled impedance), or specify the trace widths and PCB stackup (designed impedance). With controlled impedance, the fabricator would be responsible for the impedance and would measure it to verify and put the data on the first-article inspection. With designed impedance PCBs, the designer could ask the fabricator to measure the impedance as reference only, and include the data on the first-article inspection.
The latter permits more design control with the same check and balance in place to ensure proper impedance has been realized.
The point here is that a good designer will take full responsibility for the design. No one, for any reason, should alter that design except the designer. The designer knows why everything is the way it is. Changing a design without the designer will usually result in unforeseen failures. Example: The PCB manufacturer removes nonfunctional pads around a via on innerlayers because they are electrically nonfunctional. Result: The structural integrity of the via is compromised when the end-product is subjected to stress testing. How would the fabricator know that the little bit of extra structural integrity of the via is needed for the product to pass HALT (highly accelerated life testing)?
We work on products every day that are successfully subjected to thermal shock rates of 50°C per minute temperature change, between -40° and +85°C, while experiencing random vibration levels of 30G. The best solution in this situation is Note 23. This forces the fabricator to consult with the designer. Feedback from the fabricator then gets incorporated directly into the design. This process makes the design better and hopefully minimizes any room for error. The designer must be in total control of the design.
It is great to have a fabricator that can provide its “secret sauce” to make the design work, but be ready to get locked into that supplier, because another fabricator’s recipe will be different. As a designer, is that a risk you want to take? Is that a risk you want to take with your product? Is that a risk you want to take with your business?
Jeff Champa is department head, development engineering at Morey Corp. (moreycorp.com); This email address is being protected from spambots. You need JavaScript enabled to view it..
Written by Eric Bogatin, Bert Simonovich, and Yazi Cao
Category: 2010 Issues
Suggestions for optimizing vias using circuit modeling.
Vias are a necessary evil in all multilayer circuit board designs. While even a poorly designed via can be transparent below 1 Gbps, for multi-gigabit links, vias can often represent the largest discontinuity and set the maximum bit rate that can be transmitted in a link.
The process to implement a transparent via in a differential path is to match its impedance to 100 Ω and eliminate any residual stub. Unfortunately, due to real-world constraints, it is not often possible to achieve 100 Ω, and removing stubs can be expensive. A practical approach is to do everything that is free, and then simulate to see if the design will work. If it will not, then it becomes worthwhile to pay for a closer match to 100 Ω or for shorter stubs.
The first step is do the best possible in the via design. Then comes the determination whether it is “good enough.” This requires having an equivalent circuit model of the via that can be incorporated in a system simulation. While one approach is to use a 3D EM field solver to generate a behavioral S-parameter model, this is sometimes expensive in time, cost and expertise required.
An alternative is a scalable, topology-based equivalent circuit model that accurately matches via behavior to a bandwidth well above the application bandwidth, typically above 10 GHz. Here, we look at a very simple way of modeling a differential via and translating its geometry into an equivalent circuit model.
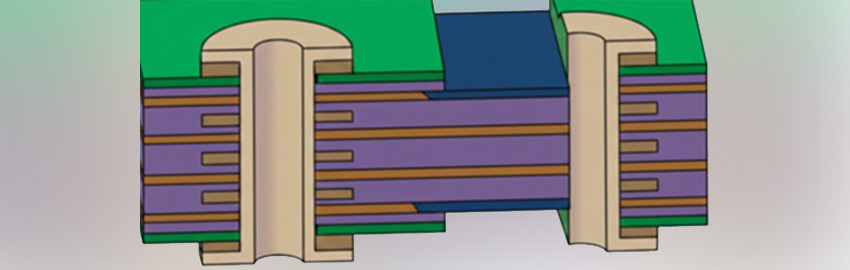
A Differential Via
All high-speed serial links route signals as differential pairs. When the pair transitions from one layer to another, it does so through a differential via (Figure 1). Of course, it is always good practice to provide a “return” via adjacent to each differential via, but this is to provide a low impedance path for any common currents that might inadvertently be on the differential pair.
The differential signal will not see the return via; it will just see the two vias that make up the differential pair. The challenge is translating the via geometry into an equivalent circuit model that can then be integrated into a channel simulation.
One approach is to use a 3D full wave field solver. This approach will handle all arbitrary features of the vias, and include all ranges of layers, plane separations and clearance holes, offering the highest bandwidth and most accurate analysis. But, the resulting answer is not scalable. It is a behavioral model for the specific geometry selected, and must be re-simulated for all variations to explore design space. It also requires a high level of expertise and may sometimes take a long time to get to the answer.
Another approach is to break each segment of the via into small discrete inductance and capacitance elements corresponding to each section of the barrel interacting with the planes and with each other. It is difficult to achieve an accurate result because the fields are inherently fringe field dominated, and matching discrete elements to overlapping fringe fields is difficult.
A third approach, described here, is to consider each via segment – the through regions and stub regions – as uniform differential transmission lines, and use a simple approximation to extract the differential impedance and time delay of each section.
If the cross-section of the via is relatively constant down its length through the board, the differential impedance of all sections of the via will be the same. It only is necessary to know the physical length of each segment and the effective dielectric constant to get the time delay of each segment.
This equivalent circuit model can be scaled for any combination of layer transitions and integrated in any channel simulation (Figure 2). When driven differentially, the odd-mode parameters of each via are most important. Since the even-mode parameters have no impact on differential performance, both odd and even-mode parameters are set to the same values.
The challenge then is to calculate the differential impedance of a differential via and the effective dielectric constant, based on its geometry.
First Order Approximation
In the simplest approximation, a differential via can be viewed as a pair of twin rods. The differential impedance of the via barrels due to the loop inductance of the two rods and the capacitance between them can be expressed as
where s = center to center separation of the vias D = via outer diameter Dk = bulk dielectric constant of the laminate
Anti-pad is the term commonly used for a clearance hole in a copper layer to prevent shorting the via barrel as it passes through each layer of copper plane in the PCB. If the anti-pads are very large compared to the drill diameter, the differential vias behave as a true twin rod transmission line, and capacitance between the vias is dominated by the fringe field coupling between the barrels. However, if the anti-pads are small, there will be extra fringe field coupling to each plane. This additional distributed capacitance loads the via barrels, thereby decreasing the differential impedance and increasing the effective dielectric constant.
In the extreme case, the capacitance between one via and the planes it passes through, the odd mode capacitance, and can be roughly approximated by a coax geometry. If the shape of the anti-pad is round, the single via capacitance per length between the barrel and the planes is given by
where D2 = diameter of the clearance hole Len = length of the via If the shape of the anti-pad is oval (Figure 3), the odd mode capacitance of the barrel to the planes is approximated by
where a = length of the oval clearance hole b = width of the oval clearance hole
The differential impedance of the vias will be between the impedance given by the twin rods and the rods with coupling to the planes, depending on the size of the anti-pads.
Including the capacitive loading from the fringe fields to the anti-pads, the differential via impedance is approximately
where Dkavg = average value of Dkxy and Dkz
There is one additional real-world complication. Conventional FR-4 laminates are fabricated with a weave of fiberglass yarns and resin. While the bulk Dk is a function of glass-to-resin ratio, it also depends on the direction of the electric fields. Materials with a Dk that varies with electric field direction are said to be anisotropic. In typical glass-resin laminates, the dielectric constant in the z axis (Dkz), which is what signals on a stripline see, may be 15-20% lower than the dielectric constant in the x-y axis (Dkxy), which is what fringe field lines between the via barrels might see.
As a slight correction for the anisotropic nature of the glass-weave laminate, the average value of the DKxy and Dkz should be used for Dkavg. If only the Dkz is known, as is commonly found in spec sheets, the Dkxy value can be taken as 1.18 x Dkz.
Effective Dk from Capacitive Loading of Via Barrels
The differential signal is slowed slightly as it passes through via barrels by the excess capacitive loading of the fringe fields between the via barrels and planes it passes through. This can be described with an effective Dk higher than the average bulk Dk.
One way of estimating this effective Dk is to take the ratio of the odd mode capacitance of the anti-pad to the odd mode capacitance of the twin rod geometry and multiplying by the average Dk
In all cases, the effective Dk will be larger than the average Dk in the xy and z directions.
Test Vehicle
A simple 26 layer test structure representative of a thick backplane design was fabricated to compare the measured impedance with the simulated impedance. It consisted of two differential via pairs separated by 6˝ of 100 Ω stripline differential pairs (Figure 4).
To explore the impact of the stub length and the through path of the via, three different stripline connections were fabricated: on layer 2, on layer 10 and on layer 20. This created via structures with long, intermediate and short length via stubs. A cross-section was performed to measure the actual length of the through and stub portion of the respective vias (Figure 5).
The differential vias had the following common parameters: Via drill diameter; D = 0.028˝ Center to center pitch; s = 0.059˝ Anti-pad dimensions = 0.053˝ x 0.073˝ Dkz of the laminate = 3.65 Anisotropy in Dkxy = 18%
The simple model for the differential impedance and effective Dk predicts this differential via will have values of Zdiff = 63.4 Ω Dkeff = 6.8
Agilent ADS software was used to compare the measured and simulated performance of differential channels on this test vehicle. The trace widths, spacing and dielectric thickness were actual values as measured through cross-sectioning of the test vehicle. The manufacturer’s published values for bulk Dk and loss tangent were used to complete the parameter definition.
The comparison between the measured and simulated results of the insertion loss and TDR response for the three via stub cases using this simple approximation methodology is summarized in Figure 6. The agreement is seen as excellent, even up to 12 GHz.
This simple model accounts for the discontinuity of the long through section and the long stub section. The predicted stub resonant frequencies match the measured frequencies very well, and the TDR plot shows excellent impedance matching and delay. This suggests a simple approximation for effective dielectric constant and differential impedance is perfectly adequate in providing a quick and accurate model for long differential vias typically used in backplane applications.
Exploring Design Space
This simple analytic approximation for differential vias can be used to explore design space. The design goal for a transparent via is to match its impedance to 100 Ω for most systems, and 85 Ω for PCIe gen2 systems.
For a given drilled barrel diameter, and a given pitch for the two vias, we can estimate the impact from the anti-pad clearance hole, and the hole size needed for a transparent via.
The anti-pad size is most often determined by two factors. First, the industry standard requires the minimum anti-pad diameter to be 0.024 in. larger than the drill diameter, and second, we want to ensure there is as much copper on the reference planes as possible to maintain good power and signal integrity for the signal traces on the adjacent layers.
For a given pitch between vias, the round anti-pad diameter can grow to the same dimension as the center-to-center spacing between vias before they overlap. Increasing the anti-pad diameter beyond this point starts to impede on routing real estate. Therefore, the design space to set the anti-pad size will be bound to Drill + 024˝ minimum to the via pitch dimension maximum.
Figure 7 shows the predicted differential impedance for a via pair, with a drill diameter of 0.015˝, and pitch of 0.050˝, 0.075˝ and 0.100˝, as the round anti-pad is increased.
This suggests that for a differential via at 0.050˝ pitch and maximum anti-pad diameter of 0.050˝; the best this geometry can do is 90 Ω. It is only after increasing the pitch to 0.075˝ would the same geometry achieve 100 Ω. Increasing the pitch beyond 0.075˝ requires the anti-pad diameter to decrease to 0.044˝ to reach 100 Ω.
For an 85 Ω system, the 0.050˝ pitch will achieve transparency quite nicely with an anti-pad diameter of 43 mils. At 0.075˝ and 0.100˝, the via geometry cannot reach the target impedance because the anti-pad diameter has reached the minimum diameter of 0.039˝ for the 0.015˝ drill size.
Conclusions
Of course this approximation is offered as a rough starting place to quickly estimate the expected performance of differential vias. If analysis using this model shows the via plays a dominant role in the channel performance, and the performance is not “good enough,” it is then worthwhile to invest the effort in using a 3D full wave model to perform a more accurate analysis and reduce the design margin needed for a robust product.
If this approximation shows that the optimized via has little impact on the channel performance, however, then it may be of greater value to invest effort in fixing other, more important problems, which will always arise in multi-gigabit systems.
Bibliography
1. L. Simonovich, E. Bogatin and Y. Cao, “Method of Modeling Differential Vias,” white paper, April 2009. 2. E. Bogatin, L. Simonovich, C. Warwick and S. Gupta, “Practical Analysis of Backplane Vias,” DesignCon, February 2009.
Eric Bogatin, Ph.D., is a signal integrity expert and founder of Be The Signal (bethesignal.com); This email address is being protected from spambots. You need JavaScript enabled to view it.. Lambert (Bert) Simonovich is with Lamsim Enterprises (lamsimenterprises.com), and Yazi Cao is a postdoctoral fellow in the Carleton University Department of Electronics.
Designers made more money in 2009 than the year before, but most were just happy to still have jobs.
Another year older, another year wiser.
The aging (graying, some say) of the printed circuit board design field continues, with nearly 60% of respondents in the annual PCD&F designer survey reporting 20 or more years’ experience. But with age does happiness come? Or are designers becoming more cynical about their chances for survival in this era of automation and outsourcing?
A few notes about the data. Starting in late April, PCD&F undertook a three-week survey of its subscribers who indicated they perform bare board design. A total of about 400 subscribers worldwide – about 100 more than in 2008 – completed an in-depth questionnaire covering salaries, job functions and titles, benefits, education, and satisfaction with their career choices.
The majority of respondents indicated they work for OEMs, though the numbers are declining. This year, OEM designers represented 65.9% of roughly 400 responses, down from 70.5% in 2008. Design service bureaus represented 8.6%, nearly flat with 2008. Those working for an EMS company represented 3.9% of respondents, while PCB fabricators and consultant/educator received 2.2% of responses, respectively (Figure 1).
High-reliability products were most frequently identified as the employer’s primary end-product, with government/military/avionics/marine/space the top response at 21.7%. Communication systems/equipment came in second at 13%. In 2008, the two were reversed, with communication systems/equipment leading 17.5% to 15.6%.
Industrial controls/equipment/robotic remained third, with 10.3%. Consumer electronics had 9.3%, while electronic instruments/ATE design and test had 9% of responses in 2010 (Figure 2).
The field remains heavily male, as men represented 85.3% of survey participants. In 2008, men made up slightly more, with 86.1%.
The youngest participant this year is 23-years-old, from Somerset, UK. The oldest respondent is 72, a designer in Burbank, CA. Overall, 41% of respondents are over 50-years-old.
The average salary globally based on this survey is approximately $79,000 (all values in US dollars unless otherwise stated). The highest salary reported was $160,000 (a US designer with a master’s in electrical engineering); the lowest salary came from India at 13,000 Rs (US$283). The lowest salary reported in the US was $21,000.
There was a significant discrepancy between those receiving raises in 2008, and those receiving raises in the past 12 months. Seventy-two percent of designers indicated they received a salary increase in 2008. Comparatively, only 49.9% of designers received salary increases in the past 12 months, while 42.4% said their salary remained the same, and 7.8% saw a reduction in salary. Some 43.8% of respondents received a bonus in the past 12 months.
Most employees stayed put: Only 5.8% said they took a position with a new employer in the last year, down from 9.3% in 2008. In the past year, 5% indicated they had been laid off, up slightly from 4.3% in 2008.
Not surprisingly, health insurance topped the list of benefits offered by the designers’ firms, at 87.3%. Dental insurance came in a bit lower at 78.4%. Nearly seventy-five percent of respondents are offered a 401(k) plan option, and 74.5% receive life insurance benefits (Figure 3). Some 8% reported receiving no benefits.
No degree required. A college degree still isn’t required for entry into the field, but it’s gaining steam. Close to 60% of respondents said they have attended college but lack a bachelor’s degree. Those attending college for one to two years or who have an associate’s degree constituted 31.3% of respondents. Twenty-six percent said they went to college, but do not have any degree. High school graduates made up 4.4%, almost half of 2008’s respondents.
Fourteen percent of designers who took the survey have a bachelor’s in electrical engineering, and another 10% have a BA/BS in a field other than EE. Some 8.3% have a master’s degree in EE, business, or another field. About 1.5% said they have done some post-graduate work; 2.5% say they have performed engineering graduate work. Less than 1% of respondents have a Ph.D.
The trend toward better educated designers could be explained multiple ways. It could be that employers are looking for degreed staff, or that they are adding design work to traditional engineers’ responsibilities. Other possible factors are that the least educated designers were the first to be let go during the downturn, or that employed designers are continuing their education even after entering the field. To the latter point, 54.8% of respondents said their companies offer tuition reimbursement. In addition, 35.5% said they were CID certified; 63.4% are not, and 1.1% are in the process of certification.
Fifty-seven percent of respondents are either satisfied with their current yearly compensation or very satisfied, while 23% are dissatisfied or very dissatisfied.
Firmed up. Most designers work at large companies. Asked about their employers’ staffing levels, 43.2% of respondents said more than 1,000. The next highest response – 19.4% – said their employer has between 251 and 1000 employees, while 10.8% have 101 to 250 employees. Ten percent said 51 to 100 staff members work for their company, while 6.4% work in a small environment of 26 to 50. The remaining 10% have fewer than 25 employees.
Likewise, in terms of revenues, 22.5% of respondents work at firms with annual sales of $1 billion or more. Another 22.2% said the company brings in $100 million or more annually. Just 12.7% said their firm has sales of less than $5 million.
For the most part (46.3%), designers who responded to the survey spend their time on PCB design and layout as a principal job function. PCB engineering is the second-place principal job at 13.6%, while 9.4% answered design/layout management. PCB layout only is the main role for 8.6%, and engineering management had 5.5% of responses. See Figure 4 for other primary job functions.
When asked whether designers are satisfied with the potential for advancement with their current employer, 38% were satisfied or very satisfied, while 25% indicated dissatisfaction or extreme dissatisfaction, while a large portion, 35.5%, had no opinion one way or the other.
In the 2010 survey, 35.2% of respondents said “senior PCB designer” best describes their job title, while 17.2% said “PCB designer” (Figure 5). Despite the titles, the job appears to be something of a solo venture, as evidenced in Figure 6. Very few designers directly supervise a substantial number of employees, while 73.7% said they have no direct reports at all.
Despite the substantial number of under-50 designers, the years of experience are striking, with 20.8% having 26 to 30 years of experience and nearly 20% having over 30 years under their belts. About 60% of the 400 respondents have more than 20 years of experience, which means only 40% aren’t nearing retirement any time soon. Are young people learning the trade?
Missing microvias. The technologies that respondents most often directly engineer, design or layout are four to six layers (84.8%), double-sided PCBs (83.9%), and seven to 10 layer PCBs (62.6%). Technologies worked with far less are MCM (10.8%), system-on-chip (SoC) (9.1%) and system-in-package (SiP) (9.1%). In 2008’s survey, BGAs were used by 61.3%; this figure inexplicably dropped to 52.9% in 2010. Microvias/HDI also dropped significantly, from a usage rate of 45.7% in 2008 to 34.9% this year (Figure 7).
The amount of work designers take on remained relatively constant with 2008, with 27.7% saying they produce six to 10 new designs per year. (In 2008, this number was almost identical, at 27.5%.) Those producing one to five new designs in 2010 constituted 23.5%, compared to 20.2% in 2008. As with 2008, designers working on 11 to 15 new designs stayed at 15%. The remaining respondents, nearly 34%, work on more than 15 designs annually.
When asked about which products or services the designers evaluate, recommend, specify or approve, more than 75% chose CAD software; 48.8% added fabrication services, and 38.8% said design services. These were the top three responses in 2008 as well. Over 30% of respondents specified connectors and cables, prototyping services, CAM software, active and passive components, assembly services, CAE software, and solder mask (Figure 8: click here).
Most designers who answered the survey said they have the ability to recommend or specify products (nearly 64%). Far fewer evaluate and approve product purchases (23.2%). Thirteen percent indicated they have no purchasing power whatsoever.
As in past years, we asked, What do you think will be the biggest challenge(s) you will face in 2010? We received a total of 231 responses to that optional question, which could loosely be grouped into four categories: Keeping Job, Outsourcing, Technology and Other. Some 77 indicated that some combination of keeping their job or not seeing their work outsourced was their biggest concern. For such a heavily technical field, that’s remarkable. Another 47 listed their workload. Many echoed a US designer with 30 years’ experience who said, “The biggest challenge that I will face as a designer in 2010 is to remain employed. For the past decade my company has been creating design centers in Asia. Over the past few years I have seen approximately 60% of the design work sent overseas. It is my expectation that in the near future, the number will increase to more than 80%. Unfortunately, I do not see a bright future for engineering and design in the US.”
Of the 72 responses specifically noting technical concerns, most had to do with shrinking component packages, board densities, high-speed designs, or some combination thereof. Relatively few respondents cited problems with CAD or other software tools.
Considering the relative age of the field and the widespread concern over job security, a cynic might suspect a lack of opportunities is what’s keeping designers in their current environments. Yet, as the survey shows, designers overwhelmingly are satisfied with their career choice. More than 87% said they are satisfied or very satisfied, while a minor 3% said they are dissatisfied or very dissatisfied.
Current job satisfaction ranked high as well, with 75% claiming they are satisfied or very satisfied. Only slightly more than 8% said they are dissatisfied or very dissatisfied with their current position.
Is it just possible that age and experience bring contentment?
Chelsey Drysdale is senior editor for PCD&F (pcdandf.com); This email address is being protected from spambots. You need JavaScript enabled to view it..
Don’t confuse your virtual partner’s competency with your own.
If I’m not mistaken, the primary goal of any business is to maximize profits by selling goods or services (or a bundle of both) to customers. In our industry, based on its history, you might be tempted to swap the word “make” for “maximize,” but we all struggle to attain that primary goal.
We’ve witnessed an evolution regarding how some achieve the what-at-times-seems-to-be elusive goal of maximizing profits. I say “evolution,” as the process has been taking place for decades. During the past 10 years, however, that natural evolution has felt much more like a very painful revolution. This process is known as outsourcing production, more commonly referred to as brokering product.
The concept dates back centuries and has its roots in cultures that focused on “trade” versus those that focused on “making” things. Over the past quarter century, our industry, like many, has seen this concept manifest itself into “new” market segments, such as EMS and ODM.
On a macro scale, we clearly are looking at the natural evolution of an age-old business concept. However, on the micro scale, in the bunker and trenches of the daily struggle to make a buck by making and then selling that good or service, experiencing the evolution work its way through our levels of the supply chain has been anything but natural or evolutionary!
Our industry has become far more specialized than it once was. The technology we have aided in creating has enabled a global economy to take hold, which in turn has made specialization not just possible, but highly profitable. Designers who have a particular technical or end-market expertise can electronically collaborate with someone across the world with complementary knowledge and skills to satisfy a common customer that neither alone could have handled. Printed circuit board companies that have niches or limited resources can offer customers a wider array of capability and products via developing relationships with other companies throughout the world.
Such opportunity has been embraced by those in the industry trying to increase the number and breadth of tools in their toolbox, and by customers themselves, who once may have insisted on vertical integration, but now are very comfortable with virtual integration. But, there are risks with virtual integration – risks for the customer, as well as risks for the company going virtual.
The risks for customers have been talked about for years. They include questions/concerns such as, Exactly where is product coming from – and where are proprietary data and intellectual property going? Will quality be assured? Will delivery be acceptable? Will problems be resolved quickly? The list reflects real concerns any customer should, and does, have regardless of from whom or where they source.
The risks for suppliers – companies trying to fatten their tool box via going virtual – are a bit more complex. Here, it boils down to the basics of knowing what you know, staying true to what you do best, and ensuring your integrity stays intact.
Knowing what you know often is where problems begin. Every company has a core competency – an expertise or product capability well known, fully understood and backed with the best in technology or service. When augmenting that core competence with the capability, service or capacity from a virtual partner, make sure you don’t begin believing that that is in fact now your core competence.
By forgetting to stay focused on what you know – and pretending to know what you don’t – the steep slope from competence to incompetence becomes more than a little slippery. A good fabricator of mid-technology circuit boards may not be able to support the demands that customers place on technical involvement when they broker, say, complex HDI product. A designer who understands electronics may have a rough time if they begin to field questions related to RF signals. But the temptation is too often very strong to begin believing you have become expert in all.
Closely related is staying true to what you do best. While all businesses need to stay in sync with the times, if you forget your roots – your core competency – it’s hard to stay true to what you do best. It’s far more lucrative to stay committed to being the best in the niche you are in than to try to emulate a virtual partner whose skills, strengths and problems you may not have any visibility into, let alone understand. In short, it’s sticking to your knitting, knowing when to go to your virtual partner, and knowing when to tell customers “I don’t know” that need to stay squarely in your sites and focus.
This all leads to ensuring your integrity stays intact. When you are upfront with customers and partners about your core competency, and understand and deploy virtual partners openly and with candor, you have a good shot at success. It’s when you begin to believe that you are your virtual partner that you start the slippery slope into the abyss known as incompetence.
Leveraging others’ capability and capacity can boost profitability. But understand the risks when adding tools to your capability tool box.
Peter Bigelow is president and CEO of IMI (imipcb.com); This email address is being protected from spambots. You need JavaScript enabled to view it.. His column appears monthly.


