Higher performance requirements reduce timing margins on interfaces, thus imposing strict rules on board routing.
Interface performance depends on bit transfer rate (as driven by the frequency of a clock) and the protocol used to transfer command, addresses and data over the interface lines. Although there are some additional commands and functional improvements in the evolution of memory interfaces from SDR to DDR, the primary performance improvement on memory interfaces is due to technologies on increasing the bit transfer rate. This article focuses on bit transfer rate evolution over the generations of synchronous memories.
Theoretically, an interface’s maximum speed is determined by the IO buffers’ switching frequency, plus the receiver input buffers’ setup and hold time requirements. However, at specifically high frequencies, the signal integrity issues on the signals need to be resolved. Through board-level simulations, board design (routing) rules are developed, also meeting timing requirements and signal quality requirements. Additionally, the routing guidelines have to be practical (easily implementable). These are the factors that lower the theoretical speed of the performance. So, then, how is the high-frequency operation achieved on memory interfaces?
Memory interfaces. The history of dynamic memories dates to the early 1970s, when computer manufacturers began offering large-size memory subsystems. With PCs becoming an integral part of daily life, demand for higher speed memories, as well as high density, has been rising: In every generation of a computing system, more memory at higher speeds is targeted. Dynamic memory devices were at first asynchronous. The system performance achievable was limited. With the advent of the synchronous memory devices, race for speed started, as the memory interface is one of the most significant parts of architectural components in a computer.
Two components make up a memory interface (like any other interface):
IO (input/output) buffer is the transistor circuit that drives and/or receives bits, digital information, on an interface. The switching speed of the transistors, based on the silicon technology used, determines the maximum (at least theoretical) speed achievable on the interface. The IO buffer technology determines voltage levels of a signal on the interface, as well as the timing with respect to the synchronizing signal; for example, data (or address or command or control) signal valid time with respect to clock or strobe from a driving IO buffer, and setup and hold times of data signals with respect to clock or strobe required by the receiving IO buffer. The strength of the IO buffer is the primary factor in driving a large number of memory devices connected on the interface.
An interconnect is the trace (line) on a printed circuit board that connects the IO buffers of ICs, forming the hardware driving and receiving functions for a logical operation (write or read).
The swing amplitude of a signal, as required by the silicon technology, representing digital information is the voltage levels of high-to-low (or low-to-high) transitions of the waveform, hence determining the speed over the interface.
Additionally, the behavior (reflections, ringing, etc.) of the interconnect signal is just another factor that affects the interface operation frequency.
First-generation synchronous memories became widely used in the early 1990s. They now are also known as SDR (single data rate) SDRAMs. A typical SDRAM datasheet is in Reference 1.1 An SDR memory channel is composed of address, command, control and data lines, and is a common-clock interface in terms of the way the clock is connected to the components.
Figure 1 shows a typical implementation of a SDR memory interface. The data bus width determines the number of devices connected in one rank. The targeted total memory size is limited by the number of chip-select control signals determining the number of ranks in the system.
Typical clock rates were 66, 100 and 133 MHz; and 155 MHz devices existed, but resulted in small-size memory implementations. Memory modules were standardized into 168-pin DIMMs.
The memory devices may be on a DIMM; the routing on each DIMM type is different from each other. The memory implementation in a system can be device-down. (Memory devices are all on the main board – no connectors, no memory modules.) That is a challenge by itself in terms of placement and routing in and out of the devices – and highly likely ending with multiple different types of topologies for each signal and pin connection.
Routing signals to the devices was constrained by signal-quality issues, limiting the size of the memory that could be implemented for a system, and presented difficulties in device placement with respect to the memory controller.
To correct signal quality issues, series or parallel termination resistors often were used, but increased cost and, in most cases, made routing more challenging.
The number of ranks determines the number of devices per data signal, while the total number of devices fixes the number of loads for each address and command signal.
To achieve higher speeds on the interface, two issues needed to be resolved:
The speed on an SDR memory interface is limited by the clock cycle time (tCYC): A signal (data, address, command or control) would be valid at the driver output (of the memory controller) after a delay from the clock and would travel over an interconnect, arriving at the receiving memory devices, meeting setup time requirement of the input buffers. That determines the allowed maximum flight time over the interconnect, which gets smaller as clock frequency goes up; however, any clock routing skew coupled with clock driver pin-to-pin skew and jitter will result in even smaller allowed flight times, hence shorter trace lengths.
The amount of load on a data signal is considerably lower than the load on an address signal. A maximum and a minimum trace length can be determined (through simulations) for correct interface operation; however, at higher speeds, the difference between the maximum and minimum length (trace length mismatch) would be smaller. Coupled with already small trace lengths at higher speeds, it is difficult to route so many short traces in a small area (imposed by placement of the components) and still meet the trace length mismatch requirement (as determined by the minimum and maximum trace length difference).
These issues were resolved by moving to DDR memory interface, which became common in the early 2000s. Figure 2 shows a typical implementation of a DDR memory channel.
Main features added to the memory interface2 are summarized below:
1. By changing the interface operation to source synchronous, the interface speed would be limited only by the skew between the clock and other signals, which still requires tight control in routing, but is easier to achieve. Flight time constraint due to common-clock cycle-time was removed.
2. Clock signal was changed to differential signaling, providing a more stable timing signal; address, command and control signals were timed with the differential clock, which captured signals at the crossing point (of the positive and negative components of the signal).
3. For IO buffers, 2.5V SSTL (stub series terminated logic) circuit technology3 was used, effectively reducing the swing amplitude of the signals to 2.5 volts. Input buffer switching occurred at Vref point (0.5xVDDQ = 1.25v) of the input waveform transition; by that, the delay to reach the threshold voltage levels was removed, which changed depending on the load.
4. One issue with source synchronous interfaces is that the distance from driver to receiver is not known, as there is no trace length (flight time) limiter (like tCYC as in common-clock interfaces). This is not an issue for a write operation when driving the data bus from controller to the memory devices; however, it is an issue during a read operation when memory devices are driving the bus and the memory controller needs to know when exactly to sample the data bus. To resolve the issue, a strobe signal was created. As it exists, the strobe signal was used for both write and read operations. The data signals were synchronized with the strobe signal (one per byte group in general) that has the same amount of load as the data signals. This made routing of the data signals and strobe signal easy to match to each other within a byte group.
5. With a stable differential clock and a strobe signal dedicated to each byte group, data transfer was accomplished on rising and falling edges of the strobe signal, hence doubling the data rate. Clock speeds were implemented from 133MHz to 200MHz, corresponding to data rates 266MT/s to 400MT/s.
6. VIH(ac) and VIH(dc) (similarly VIL(ac) and VIL(dc)) threshold levels2 were introduced), so some ringing (with amplitude between ac and dc threshold levels) on the interconnect may be tolerated without affecting the estimated/simulated flight times.
Issues with DDR. While the fact that the strobe signal trace length was to be matched to data line lengths within the same byte group provided some flexibility in routing across byte groups for high speeds, the strobe signals also had to maintain a tight timing relationship (tDQSCK, tDQSS, tDSS and tDSH)2 with the differential clock, which in turn limited the flexibility. Also, the strobe signals were single-ended, and at high-speeds, tighter length matching was required due to performance-limiting effects of any noise on the signals (possibly crosstalk).
For even higher performance on the memory interfaces, DDR24 was introduced in 2003 with speeds at 400MT/s and 533MT/s, and then 800MT/s and recently up to 1066MT/s. Memory modules (DIMMs) with 240-pin connectors were supplied. SODIMMs with tighter routing for laptop and embedded applications were designed. Figure 3 describes a typical DDR2 memory channel.
DDR2 interface designs are geared toward easing challenges experienced on DDR memory interfaces.
1. Lowering the swing voltage to 1.8V enabled the silicon process to higher-speed IO buffer technologies.5 That also provided some power reduction highly favored in high-speed applications.
2. Moving to a differential signaling for a strobe provided a more noise-immune timing signal for data lines.
3. OCD (off-chip driver) impedance adjustment feature (though optional)4 was created for the memory devices to drive DQ and DQS signals with an impedance matching the characteristic impedance of the interconnect.
4. Similarly, DDR2 IO buffers are programmable to function in full strength and reduced strength programmable based on the load. This feature can be used to reduce reflections on an interconnect with a light load.
5. ODT (on-die termination) is another feature included in DDR2 memory devices, helping data interconnect signal quality. A couple of pull-up termination values were made available, 60Ω and 120Ω, similarly programmable by the controller. ODT feature is possibly as good as on-board termination resistors, but it standardizes and optimizes, under BIOS control, the interconnect termination value for signal integrity, based on the load – amount of memory on the board – for example, the difference between using a single DIMM or two DIMMs on a two-connector memory interface. As such, ODT achieves more, saving routing and placement space needed for the on-board termination resistors.
6. A timing relationship is specified for the differential clock, address and command lines. The number of loads on the clock, address, command and command signals is the same and can be large, depending on the number of ranks in the interface. The clock signal can be easily duplicated on the controller, effectively reducing the load per clock; furthermore, the control signals need to be one per rank; hence the load on the control signals would be equal to the load on the clock signals. However, a duplication on the address and command lines would be prohibitively costly for a controller needing many additional pins on the package. Instead, 1T and 2T timing can be implemented, where 2T timing for heavily loaded interfaces provided additional time for the controller to meet the setup and hold times on the memory devices.
While 1T timing is the standard memory interface specification, 2T allows more time for address and command signals to travel over the interconnect and still meet the timing requirements on the target devices (Figure 4).
7. Additionally, further relaxation was obtained in routing the signals by introducing circuits that delay the clock signal with respect to address, command under program control. This proved to be a viable solution in memory controller designs to practical memory interface routing at higher speeds.
On interfaces where the design ends up with routing difficulties to meet length mismatch requirement between the clocks, address and command signals, a controller with a delay feature can provide the required delays of the clock signal with respect to address and command, and therefore, meet the flight-time-matching requirements; although, for example, the clock trace length may have been routed considerably shorter than other signals.
Similarly, the controller can implement delays between the clock and each byte group strobes, individually adjusting the strobe flight times with respect to the clock, so that timing relationship between the clock and each strobe can be met independently of each other, hence flexibility in routing of the data byte groups. Data signal flight times within each byte group would still be matched (within the design spec as determined by simulations) to the respective strobe trace lengths, meeting the device data input specifications. Signal flight time matching mechanism is shown in Figure 5.
Issues with DDR2 interfaces. Routing of DQ and DQS signals within a byte group should be done to meet the device-timing specifications. There is nothing that would help simplify the routing of the byte groups, requiring tighter length matching at higher speeds. Also, stepping resolution in the delay circuits would determine how well the adjustment of the delays can be performed to match the delays determined by board-level simulations. With finer resolution circuits, delays for the signals can be achieved as close to simulated values as possible.
The challenges in higher speed DDR2 interfaces – comprehensive simulations determining the routing rules, which end up being difficult to implement, resulting in high design costs – have led to advances in DDR3 memory interfaces.
The DDR3 memory interface6 is identical to DDR2 in terms of the number and types of signals, as well as several other features, i.e., ODT. The voltage was reduced to 1.5V from 1.8V in DDR2, reducing the power requirements, and also the swing amplitude, helping increase maximum frequency that can be achieved. The IO drivers were designed to have low output impedance, Ron (IO buffer on-resistance) programmable to either 34 or 40Ω, helping to improve signal quality by requiring low interconnect characteristic impedance. An interconnect with low characteristic impedance would need to be a wide trace. The frequency-dependent losses (due to skin-effect) would tend to be less on wider traces. Further, additional features are implemented in the memory devices and controller.
Figure 6 shows a UDIMM implementation of a DDR3 interface. Note the “fly-by topology” routing on the DIMM: Clock, address, command and control signals all go on the DIMM at the middle of the module and route to the left-most device (Device0 in the figure) first. Then the routing is sequentially completed to each device, eventually arriving at the right-most device (Device7), and ending with a termination that is on the DIMM. This provides several advantages to the interface implementation on the board, insofar as signal integrity:
Fly-by topology routing prevents issues related to the “tree-topology” used in earlier memory modules – specifically, reflections and larger routing area on the board; all the signals, except DQ and DQS, can be routed to the DIMM in a central area, provided the memory controller ball-map was designed to easily allow for that.
Fly-by topology routing makes it easier to achieve very short trace connections to memory device pins: This is to make sure any stub effect on the signal quality is minimized.
Fly-by topology is also used on SODIMMs, and can be used in memory-down implementations, making routing easier.
The fly-by topology, however, introduces one complication in the design: the required timing of the data, DQ and associated strobe signal, DQS. Due to sequential arrival times of the clock, address, command and control signals at the memory devices, the data transfers have to follow the same sequential order in time. For example, for a write operation, the left-most device would need to receive the Strobe0 and data signals (Byte0) in a timing relationship, as defined in the device datasheet. Through simulations, the length of the traces can be determined with respect to the clock routing. The timing of the Strobe1 and data signals, Byte1, would meet the same timing relationship, however, when clock is at device1; therefore, the memory controller has to know the delay from device 0 to device1. The delays have to be known to the controller up to the right-most device, and each device-to-device delay can be and is different from each other. The same issue is true for read operations as well. The memory controller resolves this issue by the so-called write and read leveling feature (commands) implemented in DDR3 memory devices.
The primary goal of write/read leveling is to adjust the skew (timing difference) between clock and strobe signal, such that the required relationship between the two signals is met (at the memory device for write and memory controller for read).
Though not specifically related to this discussion, the write leveling is done by the controller during interface initialization by driving and delaying the strobe signals until the memory device detects a 0-to-1 transition of the strobe and sends the transition status on the data lines to the controller, at which time the controller knows the amount of delay from one particular device to the next in the routing sequence. The controller uses this information to appropriately delay the strobe signals to be generated at the right times. Similarly, the read leveling is performed by the controller by first setting up the appropriate command register bits in the devices, and then the devices sending a predefined bit pattern (01010101….) on the data lines, along with the respective strobe signals. Once the controller captures the data from each byte group correctly, the controller determines the delays that it has to have for each strobe individually to perform the read operations correctly.
Note the delays determined as a result of leveling process include device-to-device delay, and the delay due to the data strobe trace length on the board. That ensures that strobe (along with the data) will arrive at a specific device when the clock is also there within a specified window. Therefore, the clock, address, command and control signals lengths to the first device are determined through simulations, and can be routed, including a mismatch that can be specified at that time between the clock trace-length and the trace-lengths for other signals. The trace-length of the strobe signal to the first device is also determined through simulations and routed within a mismatch window with respect to the clock, as specified in the datasheets. The trace lengths of other strobes would follow the same mismatch rules. However, larger length mismatches between any strobe signal and the clock can be achieved for the interface, depending on how large the amount of delay that delay registers can hold, upon completion of write-leveling. This implies the trace lengths of the byte groups can be largely different from each other, and provides high flexibility in board routing.
Figure 7 shows an example where the length of the Strobe0 is determined by simulations to have a delay of “dly0” from the clock. After a write-leveling operation, the controller determines the delays for other strobes, for example a delay of dly1 for Strobe 1 that may have a different trace length, and a delay of dly7 for Strobe7 that may be of a different length than all others. Note that with the delays, the strobe-clock window as specified in the datasheet is achieved.
The length of data signals within a byte group with the respective strobe signal should be determined through simulations and routed to meet the specified timing given in the data sheets.
The function of read-leveling is similar: Upon signaling from the controller, the memory devices start sending 0101 … pattern on all data signals, along with the corresponding strobe signals. The controller determines the delays required to receive each strobe and corresponding byte group when it reads the data pattern correctly during the leveling.
Note the finer the resolution of steps in the delay function, the better the alignment can be done, and the larger the mismatches that can be adjusted to meet the timing windows. Additionally, smart controllers can help achieve finer adjustments under BIOS control.
Issues with DDR3 interfaces. Routing DQ and DQS signals within a byte group should be done to meet the device timing specification that is more critical at higher speeds. This is the same issue as for DDR2. Also, the maximum difference between the lengths of the strobe signals depends on the timing window within which the delays can be adjusted with respect to the clock. The delay circuits need to have finer time-stepping capability, which increases the circuit complexity. Other types of memory designs are also available. Registered DIMM (RDIMM) is one implementation where the address, command, control signals and clock are buffered by a register and a PLL on the memory module, effectively reducing the load to 1 per rank of memory devices for each signal. That certainly achieves good signal quality in many applications due to smaller and balanced loading on the signals. The data and strobe signal connections would be the same as for other design implementations.
However, the register(s) and clock PLL present an additional power requirement and cost in system implementations. The other implementation is similar to RDIMM, the LRDIMM (Load-Reduced DIMM), where all interface signals are buffered, effectively achieving a single load per memory module on the channel, good for systems with high memory capacity.
Summary The performance requirements in systems – specifically, the role of the memory interface in system performance – cannot be ignored. Higher performance requirements, in turn, reduce timing margins on interfaces, imposing strict rules on board routing. Additional creative features, aided by software, will be needed, and will continue to be included in the design of the future memory devices and memory channel controllers, to make the design and routing of the interconnects feasible, as well as the meeting of signal integrity requirements at high speeds.
References 1. Synchronous DRAM; http://download.micron.com/pdf/datasheets/dram/sdram/64MSDRAM.pdf. 2. Jedec JESD79F, Double Data Rate (DDR) SDRAM Specification. 3. JESD8-9B, Stub Series Terminated Logic for 2.5v (SSTL_2). 4. Jedec, JESD79-2E, DDR2 SDRAM Specification. 5. Jedec, JESD8-15A, Stub Series Terminated Logic for 1.8 V (SSTL_18). 6. Jedec, JESD79-3D, DDR3 SDRAM Specification.
Hal Katircioglu is manager, Platform Engineering Signal Integrity Group, ECG, at Intel Corp. (intel.com); This email address is being protected from spambots. You need JavaScript enabled to view it..
An integrated flow compresses the traditional simulation-to-design cycle.
You can’t build a house without blueprints. So why do so many RF design flows try to build a board without a schematic? Often, this crude process came about due to lack of availability of RF design tools. But the wireless industry is the new cool kid on the block. As a result, EDA software vendors are scrambling to disencumber the rigid PCB world of tailored processes and streamlined user flows. RF engineers demand freedom from constraints, so EDA vendors are peeling back the layers of traditional PCB design and opening some excellent solutions. But with these solutions, RF engineers are challenged to rethink their request for primitive simplicity and consider a higher level process.
To successfully examine the RF design challenge, it is important to first examine a “traditional” RF design flow. The term “traditional” is meant to convey the flow is a common solution for many cutting-edge companies that had no software tools to help them. It is fair to say many of these design flows were established years ago, before software tools gained strength in the RF specialty.
This traditional RF design process is most easily identified in its use of DXF file transfer to bridge the RF and PCB design gap (Figure 1). But there are real problems with using primitive shapes in an advanced PCB design software package. Designers often have to “trick” the software system by copying the primitive objects into component geometries, or by trying to manipulate the shapes as area fill objects.
In addition, the primitive shapes cannot be easily modified. And if they are modified, design rule checks (DRCs) can’t be fully exercised, introducing instability into the design. In short, designers are left trying to use software methods never intended for RF design.
Even for the many RF design companies that have navigated their way through these issues, one glaring problem remains: There is no schematic. This means there is next to no control over the connectivity, and the presence of a schematic for the PCB portion of a mixed RF-digital-analog design becomes almost useless because the schematic and layout cannot be synchronized without dangerous workarounds. Reverse-engineering solutions can help these issues, but even then, the layout-driven design process can be messy and time-consuming. In the end, designs are difficult to reuse and only partially archived.
An Integrated RF Design Flow As RF designs have gained a larger share, RF engineers and EDA software vendors have teamed to work out a better design process. EDA vendors have taken on more of a consulting role, where the needs of the RF community are heard, and then steps are taken to try to ease their pain points in the design process. Most vendors now are gravitating toward a fully integrated solution with bidirectional data transfer between the RF simulation applications and schematic and layout tools (Figure 2).
While this new process is not as simple as the traditional DXF data transfer method, it offers many more advantages. The simulation-to-design cycle is now shortened into direct bidirectional data exchange with the schematic. This means the RF circuit can be designed and simulated at any time during the PCB design and layout process, and changes transferred much more quickly.
In addition to shortening the design cycle, the schematic has finally entered the picture. Just as building a house requires blueprints, the RF and mixed signal circuits are now complete “blueprints” that can be reused in new designs, used for future design revisions, and properly documented and archived.
This is just the first step forward: With the intelligence of RF models and connectivity represented by the schematic, the same intelligent RF models can be placed into the layout. This is superior for any RF design that utilizes parametric models, because it facilitates changes. The layout software can provide the model’s parameterized options for editing, and even help readjust surrounding microstrip or stripline elements to properly reflect shape changes. These changes can be back-annotated to the schematic and then returned to the RF simulation tool for analysis to ensure the circuit still performs properly. Now that intelligent circuits are placed into schematic and layout, they can be organized into blocks for use in other designs or for fast placement of arrays of repeated circuits that occur in layout. The blocks can be stored in a library and managed just like standard component geometries, so every designer can have instant access to the latest design revisions.
It is fair to say the benefits gained by using an integrated, schematic-based system for RF design and layout far outweigh the arguments for sticking with tried-and-true DXF file transfer methods. It is understandably difficult for design environments to embrace process changes such as those proposed here, but the same effort and coordination that it takes to keep a design environment running could easily be channeled into embedding a new way of doing things. In an RF design environment that must stay on the cutting edge, some consideration should be given to the processes that EDA software tools have defined and are now supporting in established RF design environments.
Abby Monaco, CID, is a product manager at Intercept Technology Inc. (intercept.com); This email address is being protected from spambots. You need JavaScript enabled to view it..
Written by Allen F. Horn III, Ph.D., John W. Reynolds, Patricia A. LaFrance and James C. Rautio, Ph.D.
Category: 2010 Issues
Increasing conductor roughness alone increases the effective Dk in thin circuitry by up to 15% while substantially increasing dispersion.
In 1949, S. P. Morgan1 published a paper numerically modeling the effect of regular triangular and square patterned grooves in a conductor surface on the conductor loss at different frequencies. As the skin depth of the signal approaches the height of the grooves, the conductor loss increases. With grooves with an aspect ratio of about 1:1, the maximum increase of a rough conductor is a factor of two for a signal traveling perpendicular to the grooves and considerably smaller for a signal traveling parallel. A simple explanation of the mechanism is that the small skin depth signal must travel along the surface of the rough conductor, effectively increasing the path length and conductor resistance.
The Morgan correlation was adapted into an automated microstrip insertion loss and impedance calculation described by Hammerstad and Jensen2 (H&J). The correlation is incorporated as a multiplicative correction factor KSR to the attenuation constant calculated for a smooth conductor.
where acond, smooth is the attenuation constant calculated for a smooth conductor and
where RRMS is the RMS value of the conductor roughness and δ is the skin depth.
It should be noted that both acond, smooth and KSR are functions of frequency. When the ratio of RRMS/d is small, as with a smooth conductor or at low frequencies where the skin depth is large, the value of KSR is close to one. As the ratio becomes large with higher profile conductors and higher frequencies, the value of KSR approaches two. This correlation predicts a “saturation effect;” i.e., that the maximum effect of the conductor roughness would be to double the conductor loss. This result also implies that the conductor loss for a lower profile foil will eventually approach that of a rough foil as frequency increases.
Groisse et al3 describe a similar factor Cs for correcting conductor loss for the surface roughness and skin depth
using the same symbols as in Eq. 2. Similar to Eq. 2, the conductor roughness attenuation factor “saturates” and reaches a maximum value of 2.
The calculated Morgan (solid lines) and Groisse (dotted lines) conductor profile correction factors are compared graphically versus frequency for values of the RMS surface profile from 0.2 to 3 µm (Figure 1). They exhibit good agreement at lower frequencies, but deviate as frequency increases. The Morgan correlation predicts a higher conductor loss where the deviations occur. Both correlations will saturate at a value of 2, but the Morgan factor reaches the maximum value at a lower frequency.
Historically, the Morgan correlation has agreed reasonably well with measured values for typical microwave circuit substrates that are generally thicker than those currently used in digital applications and at moderate frequencies. Figure 2 is a plot of “differential insertion loss data” from 1 to 10 GHz for a 0.020˝ thick 2.2 DK type GR PTFE-random glass laminate with 50Ω transmission lines clad with copper foils with profiles ranging from 0.4 µm RMS to 3.0 µm RMS. These are compared with the values calculated using the method of Hammerstad and Jensen for smooth foil and the “maximally rough” increase of a factor of two in conductor loss. The data show good agreement with the calculated values bracketing the measured data.
It is textbook4 knowledge that the loss of a medium contributes to the phase constant, as well as the attenuation constant, in the exact solution. The values for a homogeneous medium are given by
where a is the attenuation constant; b is the phase constant; w is the angular frequency; e is the permittivity; µ is the permeability, and s is the conductivity of the medium. While Eq. 4 and 5 apply only to a homogeneous medium, the general concept that loss (as represented by s) will influence the phase constant applies to practical circuitry as well.
It should also be noted that in many of the simpler circuit models and simulators, the phase constant in a “good dielectric” is approximated by
In the present work, we show data that demonstrate significant deviations from the behavior described by these correlations caused by the conductor profile. In particular:
Conductor roughness can cause more than a factor of 2 increase in conductor loss.
“Saturation” does not occur, at least up to 50 GHz; i.e., a lower profile foil will exhibit lower conductor loss than a higher profile foil, even at higher frequencies.
An unexpected influence of conductor profile on the phase constant is particularly evident in thinner laminates. The effect is larger than predicted simply by including the loss, and appears to be directly related to the profile itself.
Several recent papers have examined the effect of conductor roughness on the insertion loss of PCB-based transmission lines.5-9 Brist et al5 and Liang et al6 used the Morgan correlation (Eq. 2) to achieve a causal model of laminate performance that agreed well with measured data up to 20 GHz. Hinaga et al7 used a similar correlation to obtain more accurate dielectric loss values. Chen8 used numerical EM modeling of a rough conductor with electroless nickel-immersion gold plating and achieved good agreement with measured data. Tsang et al9 have performed numerical and analytical simulations that show that for multiscale rough surfaces (in contrast to the periodic surfaces treated by Morgan), saturation does not occur, and increases of greater than a factor of two in conductor loss can occur.
The present authors found only two recent papers directly addressing the effects of conductor profile on the phase constant. Ding et al10 have conducted modeling of wave propagation in a randomly rough parallel plate waveguide. They state, “The phase angle of the coherent wave shows that the rough waveguide exhibits more phase shift than a smooth waveguide corresponding to an increase in phase constant,” though the magnitude of the effect is not quantified.
Deutsch et al11 measured the relative dielectric constant (eR) of 0.0025˝- and 0.010˝-thick samples of FR-4 clad with rough and smooth copper foil using the “full sheet resonance” test method.12 The calculated eR of the thin substrate clad with the rough foil was approximately 15% higher than that of the same thickness substrate with smooth foil. The increase in calculated εR of the thin substrate clad with the smooth foil was considerably lower. Modeling with both a 3D, full-wave electromagnetic field solver and a 2D code that included the detailed profile of the conductors confirmed the approximate magnitude of the measured results. The authors attribute the increase in calculated eR to the increase in inductance caused by the conductor profile. Both the models and measured data also show an increase in dispersion (frequency dependence of eR) also caused by the effect of conductor profile on inductance.
Samples and Experimental Methods
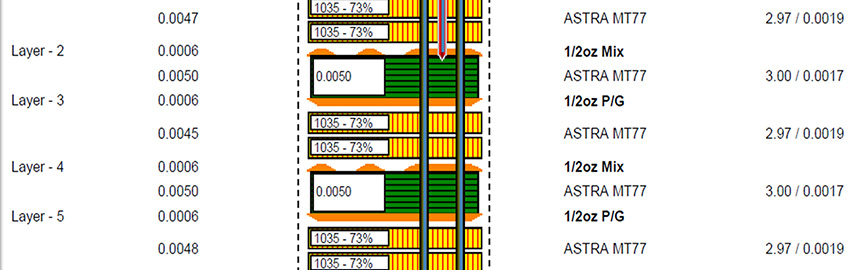
Microstrip laminate samples. Fifty-ohm microstrip transmission lines were photo-lithographically etched onto Rogers ULTRALAM 3850 copper foil clad LCP (liquid crystal polymer) laminates of thicknesses of 0.004˝ to 0.020˝. The novel laminate is a glass fabric-free, pure resin circuit substrate that relies on the inherently low CTE of the oriented LCP film to achieve a good in-plane CTE match to the copper foil. Since the novel substrate consists of a single pure substance, the variation in the dielectric properties is inherently low, and there is no question of “glass to resin ratio” affecting the dielectric properties.
The samples were made in thickness increments of 0.004˝ from 0.004˝ to 0.020˝ by plying up 0.004˝ sheets and laminating them in an oil-heated flat bed press.
The 50Ω line widths were calculated using the method of Hammerstad and Jensen that is incorporated into Rogers’ novel impedance calculator program, MWI. The MWI program incorporates Eq. 2 to correct the conductor loss for conductor profile. However, since the method of H&J uses the simplified equation for the phase constant (Eq. 6), changing the conductor loss does not alter the calculated phase constant.
Copper foil cladding and profile measurements. The majority of planar circuit substrates are clad with one of three types of commercially available copper foil specifically manufactured for that purpose: rolled annealed (RA), electrodeposited (ED) and reverse-treated (RT). The foils are treated by the foil manufacturers with different types of treatments to improve and preserve adhesion to different types of circuit substrates. Historically, high-profile (“rough”) foils have been used to increase adhesion to the dielectric material, while lower profile foils are used to improve etch definition or reduce conductor loss.
The surface profiles in the current work have been characterized using a Veeco Metrology Wyko NT1100 optical profiling system. The profile can be characterized by a variety of different statistics, including rz, the peak-to-valley roughness, rq (or RRMS), the root-mean-square roughness, and the surface area index. RRMS is most widely used in characterizing conductor roughness in high-frequency electrical applications.
RA foil is produced from an ingot of solid copper by successively passing it though a rolling mill. After rolling, the foil itself is very smooth, with an RMS profile (RRMS) of 0.1 to 0.2 µm. For printed circuit substrate applications, the foil manufacturer additively treats the rolled foil, increasing the RRMS to 0.4 to 0.5 µm on the treated side.
ED foil is produced by plating from a copper sulfate solution onto a slowly rotating, polished stainless steel drum. The “drum side” of ED foil exhibits an RRMS of about 0.1 to 0.2 µm, similar to untreated RA foil. The profile of the “bath side” of the plated foil is controlled by the plating conditions, but is considerably higher in profile than the drum side. The ED foil manufacturer generally applies a further plated treatment to the bath side of the foil for improved adhesion and chemical compatibility with the intended dielectric material. ED foils have historically been manufactured with RRMS values in the range of 1 to 3 µm. The 2500X SEM photograph visually demonstrates the difference between a high profile (3 µm RMS) ED foil and a low profile (0.5 µm RMS) RA foil (Figure 3).
RT foil is produced from an ED-based foil. To produce RT foil, the adhesion promoting treatment is applied to the drum side of the base foil. In our experience, the RRMS values for RT foil are typically 0.5 to 0.7 µm.
In the present study, samples were clad with one type of RA foil with an RRMS of 0.4 µm, three grades of RT foil with RRMS values of 0.5, 0.6 and 0.7 µm, and two grades of ED foils with RRMS values of 1.5 and 3.0 µm.
The microstrip samples were held in an Intercontinental Microwave W-7000 Universal Substrate Fixture. The setup was SOLT calibrated to the cable ends. The S11, S21 and phase length of 3.5˝ and 7.0˝ long samples were measured using an Agilent PNA-L 50 GHz network analyzer. S11 was generally lower than –20 dB over the frequency range recorded. The S21 values and phase length values of the short samples were subtracted from those of the long samples and divided by the difference in length to yield the transmission line’s insertion loss (dB/inch) and differential phase length (radians/inch).
Results. Insertion loss results up to 50 GHz (Figure 4) for copper foils with profiles of 0.5, 0.7, 1.5 and 3.0 µm on the 0.004˝ thick LCP dielectric material show a number of interesting features. The measured data for the 0.5 µm profile foil nearly match the line calculated for smooth foil using the method of H&J and the MWI impedance calculator. The line calculated for conductor profile of 1.5 µm (white line) matches the measured data at low frequencies, but at frequencies higher than about 20 GHz, the measured data are substantially higher in loss than the calculated data. The same general features are exhibited by the 3 µm profile measured and calculated data.
The calculated line for 3 µm profile (black diamonds) matches the measured data up to about 10 GHz. At higher frequencies, the measured data exhibit substantially higher insertion loss than the calculated line.
One should also note the calculated insertion loss for the 1.5 and 3 µm profile conductors are essentially identical beyond about 15 GHz, while the measured data show that the 3 µm profile foil is higher loss all the way to the maximum measured frequency of 50 GHz.
These data clearly show that saturation does not occur, at least up to frequencies of 50 GHz, and that the effect of conductor profile is larger than predicted by the Morgan correlation at frequencies above 10 GHz.
The effective dielectric constant of the microstrip circuit, Keff, was calculated from the differential phase length from 8 to 50 GHz, and smoothed with a fourth order polynomial fit, and the data are plotted for the four copper types in Figure 5. There is a substantial effect of the copper profile on the Keff value. For the 0.5 µm profile foil, the Keff value is about 2.36 at 10 GHz, while the value for the 3 µm profile foil is 2.66 at the same frequency. Clearly, the propagation constant is strongly affected by the conductor profile.
One measure of the magnitude of the effect of conductor roughness on the propagation constant is to “back calculate” the substrate dielectric constant, Ksub, using the measured dimensions of the microstrip transmission line and the Keff calculated from the measured differential phase length. Figure 6 shows results of calculating Ksub using the equations of H&J in the MWI impedance calculator, and the Keff data shown in Figure 5.Clearly, changing the copper profile alone makes a substantial difference in the calculated Ksub for 0.004˝ thick laminate. The laminate clad with the 3 µm RMS profile foil exhibits a calculated Ksub nearly 15% higher than that of the same material clad with the 0.4 µm RMS profile foil.
Additionally, the insertion loss and phase length of 50Ω transmission lines were measured from 5 to 35 GHz on a series of LCP laminates ranging in thickness from 0.004˝ to 0.020˝ in 0.004˝ increments. The materials were clad with three types of copper foil: 0.4 µm RMS profile RA foil, 0.6 µm RMS RT foil, and 3 µm RMS ED foil. A plot of the calculated Ksub (calculated again from the phase length data using the equations of H&J) versus frequency (Figure 7) is shown for the five different laminate thicknesses clad with the low profile (0.4 µm RMS) RA foil. The Ksub value increases less than 2% as the laminate thickness is reduced from 0.020˝ to 0.004˝, and the Ksub versus frequency is relatively flat.
A similar plot (Figure 8) for the same materials clad with the high-profile (3 µm RMS) ED foil shows quite different behavior. The calculated Ksub for the 0.004˝ laminate is about 12% higher than that calculated for the 0.020˝ material.
A plot of the Ksub averaged from 5 to 34 GHz versus laminate thickness (Figure 9) from the same data set demonstrates again that the circuits clad with the low profile exhibit only a small change in Ksub, while the high-profile foil-clad laminates exhibit a large increase as laminate thickness decreases.
We emphasize that the intrinsic substrate dielectric constant cannot be a function of the RMS roughness of the copper foil. Rather, the conclusion is that this apparent dependence of the dielectric constant on conductor profile illustrates an inadequacy of the previously applied conductor models.
“Dispersion” is the change in dielectric constant with frequency. For all well-behaved dielectric materials, there is a general decrease in dielectric constant as frequency increases. For the present analysis, we have quantified dispersion as the difference in calculated Ksub at 5 GHz and 34 GHz. A plot of dispersion versus laminate thickness (Figure 10) shows there is a relatively small increase in dispersion as one decreases the laminate thickness when the material is clad with the low-profile foil, and a comparatively large increase in dispersion when clad with the high-profile foil.
Modeling of current results. Based on the results of Tsang et al9 and Ding et al10, detailed modeling of the conductor profile at least qualitatively matches the features of loss data observed in the present work. Both the “greater than factor of two” increase in conductor loss due to profile and the “lack of saturation” (at least up to 50 GHz) are calculated in these references and experimentally observed in the current work.
Deutsch et al11 also show that complete electromagnetic wave simulation, which includes detailed roughness, predicts an increase in phase constant that is similar in magnitude to that seen in present work. These complete simulations, which include the submicron scale of roughness, will be very time-consuming, particularly on structures of any practical degree of complexity.
On the other end of the spectrum of simplicity, models such as Hammerstad and Jensen2, while including the “Morgan correlation’s” effect of conductor profile on loss (Eq. 2), show no effect of loss on the phase constant, since β is calculated using Eq. 6.
The authors tested several circuit simulation software packages and found similar results: Changes in the input conductor loss did not cause any change in the calculated phase constant.
To match the increase in conductor loss of higher profile foils, some circuit design software providers advise decreasing the value of the conductor conductivity, s, input to the model. The authors also tested several software packages by varying the input value of σ input to the model observing the effect on the s phase constant. In some cases, changing the input value of conductivity to the model did not cause a change in b. The models presumably calculate the phase constant by Eq. 6.
In more detailed software models, decreasing the input value of conductivity indeed increased the phase constant (as suggested by Eq. 5). However, as will be demonstrated in the following section, the measured increase in phase constant is considerably larger than that caused by the increase in loss alone.
Evidently, the conductor roughness itself imparts changes in the conductor performance that are reflected in a new conductor model presently under consideration by Sonnet Software.
Considerations on Modeling Surface Roughness A spectrum of modeling approaches addresses the surface roughness problem. At the very high end are full three-dimensional volume meshing EM tools like CST and HFSS. In these cases, one can analyze the actual shape of the conductor surface. This has the advantage that the possibly very complicated frequency-dependent effect due to specific microstructure in the conductor surface is precisely included. The disadvantage is that analysis time is excessive for all but the simplest of circuits.
In addition, the exact microstructure, or even important aspects of the nature of the microstructure, might not be known.
At the other end of the spectrum, we have empirically derived closed-form models, such as Hammerstad and Jensen, that have been available for the better part of a half-century. While these are simple, widely used and easily programmed, in certain cases they show considerable error when compared to measurement. An example of a shortcoming typical of these models is the failure to include the effect of loss on the phase constant.
In the mid-ground are closed-form surface impedance models combined with planar EM analysis. The simplest model is to include resistance based on skin effect, which varies with square root of frequency. This fails at low frequency because square root of frequency is zero at DC, but the resistance is not zero. The next step up in sophistication correctly includes the transition between skin effect (high frequency) and pure resistance (low frequency). This is the level at which most planar EM software now exists.
Proceeding one step higher, the surface impedance model can include surface inductance, which is also inherent in skin effect, but is often ignored in microwave design tools. (This is the present model used by Sonnet Software.) As we show here, even this additional surface inductance is not sufficient to explain large discrepancies from measured results that include surface roughness. This is where the most sophisticated surface impedance model, with results reported here, becomes critical for design success.
Surface roughness effects on insertion loss. Figure 11 shows measured insertion loss for the novel substrate of 0.004˝ thickness. There are two measured curves. The better, lower insertion loss curves are for 0.5 oz (0.0007˝ thick) RA copper foil with an RMS surface profile of 0.4 µm. This profile value is about 0.4% of the substrate thickness. We choose to use this case to approximate perfectly smooth foil.
The higher insertion loss curve in Figure 11 was measured on a 50 Ω microstrip transmission line made on the same substrate, but clad with the 0.5 oz. ED foil with the 3.0 µm RMS profile. This profile represents about 3% of the substrate thickness.
The measured insertion loss curves are to be compared with three curves simulated by Sonnet Software, using the measured physical dimension of the actual circuits, a eR value of about 3.0, and tand of 0.002 for the LCP dielectric material.
Looking at the lower insertion loss curves, the “Sonnet – smooth Cu” curve is a nearly perfect match to the measured insertion loss for the smooth foil, “Measured – 0.4 µm foil.” This curve was calculated using the laboratory value of copper conductivity (s = 5.8×10⁷ S/m).
However, we have a different story for the lower set of three curves. In the first simulation attempt, we match the higher frequency insertion loss values by decreasing the input value of the copper conductivity to a factor of 0.12 times that of copper (s = 0.7×10⁷ S/m). The measured data for the 3.0 µm RMS foil do not show a good match with Sonnet data that were calculated in this manner. In fact, at low frequency, the error approaches 100%. In addition, the DC resistance of the line is now substantially increased (by 1 / 0.12 = 8.3 times).
In the third simulation, we use a new conductor model, which adjusts the conductor properties appropriately to reflect the effect of the conductor profile. We note, however, that the new Sonnet model for roughness represents the insertion loss nearly perfectly.
Surface roughness effects on Keff. If we temporarily ignore the erroneously high values of insertion loss at lower frequency in Figure 11 and use the same decrease in conductor conductivity (to a value of s = 0.7 × 10⁷ S/m ) to model the effective dielectric constant, Keff, of the microstrip lines, we will note that the agreement between predicted and measured values is even poorer.
In Figure 12, the five curves are for the same five cases; only now the measured effective dielectric constant, Keff, is plotted versus frequency. In this case, the lower two curves are for the smooth foil case. The measured and Sonnet-calculated Keff values are nearly identical. Notice the measured Keff for the rough foil case is much higher. One can imagine the current flowing in and the skin depth is on the order of (or less than) the RMS surface roughness. Ideal skin effect increases both surface resistance and surface inductance. Thus, a decrease in bulk conductivity should increase Keff. However, merely decreasing the bulk conductivity to the value of s = 0.7×10⁷ S/m that best fits the insertion loss data does not increase the Keff nearly enough to match the measured data for 3 µm RMS profile foil. This approach results in a Keff increase of only about 2%. The measured increase is greater than 10%.
Comparing the upper two curves for measured data on 3 µm RMS foil and the same Sonnet new conductor model that perfectly predicted the insertion loss in Figure 11, one will note that the new Sonnet roughness model duplicates the Keff almost perfectly across the frequency range.
Verifying results as a function of substrate thickness. The next question is whether the same conductor roughness model can predict the measured effective dielectric constant for different thickness substrates that use the same foil. Figures 13-18 show three more cases using exactly the same Sonnet metal roughness model developed for the 0.004˝ laminate. In these three pairs of figures, we clearly demonstrate that the measured values of insertion loss and Keff on 0.008˝-, 0.012˝- and 0.016˝-thick substrates (clad with the same foils used in the 0.004˝ laminate example) are matched very well by the simulations using the measured circuit dimensions and the same new conductor model developed for the 0.004˝ laminate. We see that the new conductor model matches the measured data nearly perfectly in all cases.
The fact that the predicted Keff values match the measured values over the entire frequency range also demonstrates that the new conductor model accurately predicts the higher dispersion for high-profile foils on thinner substrates shown in Figure 10.
Conclusions
Contrary to early correlations, but consistent with more recent modeling,9,10 it is experimentally demonstrated that conductor roughness can cause more than a factor of two increase in conductor loss.
Again, contrary to earlier correlations, but consistent with the more recent reference,9,10 “saturation” does not occur, at least up to 50 GHz. This means a lower profile foil will exhibit lower conductor loss than a higher profile foil, even at higher frequencies.
An unexpected influence of conductor profile on the phase constant is particularly evident in thinner laminates. The effect is larger than predicted simply by including the loss, and appears to be directly related to the profile itself.
The above data show that simply decreasing conductor bulk conductivity or applying a roughness correction factor to the attenuation constant is an inappropriate model for including the effect of surface roughness, both with respect to insertion loss and with respect to Keff. The new Sonnet conductor roughness model, however, can achieve a very high degree of agreement with measured data of both insertion loss and Keff, and is experimentally shown to be independent of substrate thickness.
Acknowledgments The authors would like to thank Professor Rajeev Bansal, University of Connecticut, Storrs, for helpful conversations, calculations and advice, and Dr. Gongxian Jia, Huawei Technologies Co., for confirming measurements and conversations.
Ed.: For a list of references, see the online version. This article was drawn from a paper of the same title presented at DesignCon 2010, and is published here with permission of DesignCon.
Allen F. Horn, III, Ph.D., is an associate research fellow; John W. Reynolds is senior engineering assistant, and Patricia A. LaFrance is engineering assistant at Rogers Corp. (rogerscorp.com). James C. Rautio, Ph.D., is founder of Sonnet Software (sonnetsoftware.com).
On April 6 in Las Vegas, CIRCUITS ASSEMBLY handed out its annual Service Excellence Awards for the 18th time. The program recognizes EMS providers and electronics assembly equipment, materials and software suppliers, as judged by entrants’ own customers.
In previous years, the reception was held the day before the exhibit hall opened; this year, the event took place during the show. Participants said they appreciated the convenience of the location and the timing, which allowed customers to witness the proceedings.
Amid cheers, clapping and flashing cameras, EMS firms with the highest overall customer service ratings were announced, including repeat winner Mack Technologies in the large company (more than $100 million) category, Western Electronics in a highly competitive medium company ($20 million to $100 million) category, and returning winner, Krypton Solutions in the small company category (under $20 million).
Other EMS firms were honored in each of five individual service categories. (Overall winners were excluded from winning individual categories.) In the small-company category, Screaming Circuits held the top spot in the areas of dependability/timely delivery and manufacturing quality, and tied with I. Technical Services for responsiveness and technology. I. Technical Services won the value category.
In the medium-company category, Applied Technical Services took highest honors for dependability/timely delivery and responsiveness. NBS Corp. won for quality, technology and value.
In the large company category, EPIC Technologies swept all five individual categories for the second year in a row.
Electronics assembly equipment award winners were Assembléon America for pick-and-place; DEK International for screen printing; Kyzen Corp. for cleaning/processing materials; YESTech for test and inspection; OK International for soldering equipment; Nordson EFD for materials, and Air Vac Engineering for rework/repair. Aegis Industrial Software received top honors yet again in the manufacturing/supply chain management software category.
A donation of $2,500 was made on the participants’ behalf to the Surface Mount Technology Association’s Charles Hutchins Educational Grant. Part of each participant’s entry fee was included in the donation. CIRCUITS ASSEMBLY has contributed more than $55,000 to the fund over the years.
In addition to honoring the SEA winners, CIRCUITS ASSEMBLY and PCD&F gave awards for the 2010 New Product Introduction Award for electronics assembly equipment, materials and software, as well as PCB design and fabrication.
The NPI Award, in its third year, recognizes leading new products during the past 12 months. An independent panel of practicing industry engineers selected the recipients.
The winners included Production Solutions for its Red-E-Set Ultra HD for automation tools. In the cleaning equipment category, Aqueous Technologies took home the prize for its Trident Quad. Kyzen received an award for cleaning materials with Aquanox A4703, while Assembléon received top honors for its MC-24X in the high-speed component placement category.
For multi-function component placement, Europlacer won for the XPii-II SMT Assembler, and Data I/O scored a win for device programming with FlashCORE III. Polyonics received an award for labeling equipment with its XF-781 Thermal Transfer Printable Polyimide, and FCT Assembly won for NC160 Flux in the flux materials category.
For process control tools, KIC took top honors for e-Clipse Thermocouple Attachment, and R&D Technical Services won for rework/repair tools with Vaporworks 24 Rev 2.
DEK’s VectorGuard Platinum Dual Layer Stencil won for screen/stencil printing, while Panasonic was honored for production software with PanaCIM Enterprise Edition. Microscan and its TTC solution received an award for process control software, and Valor won for management software with MSS.
In the soldering materials category, Cobar Solder Products won for Aquasol. For reflow soldering, Speedline Technologies won for the OmniMax reflow soldering system. Juki was honored for selective soldering with the Inline Flex Solder W510. Wave soldering went to Seho Systems for Real-Time Fluxer Control, and soldering (other) went to EVS International for the EVS 9000 solder dross recovery solution.
For ICT, Acculogic was honored for the FLS980Dxi Flying Scorpion. Koh Young took top honors for AOI with the Zenith 3D AOI system, and Henkel won in the adhesives category for Hysol Eccobond CA3556HF.
For laminates, Rogers received an award for RO4360 Thermoset. WKK held the top spot for imaging for its X-Pose SM120 exposure system. National Instruments won for system modeling and simulation tools for NI Multisim 11.0 circuit simulation and analysis software, and for PCB design tools, Sunstone Circuits’ PCB123 took home the prize.
After a difficult 2009, this show was upbeat and hopeful for the rest of 2010 and beyond. The awards reception was no exception. SEA winners and other participants alike were eager to receive reports providing feedback from their customers, and the sheer number of NPI entrants is a positive sign that in a slow growing economy, companies are still focusing on bring new technologies to market.
Look for 2011 award program information at circuitsassembly.com and pcdandf.com in the summer months.
Chelsey Drysdale is senior editor of CIRCUITS ASSEMBLY; This email address is being protected from spambots. You need JavaScript enabled to view it..
Quality printed circuit boards require more than quality manufacturers.
It never ceases to amaze me that OEMs and design bureaus deliver watered down and unintelligent data to their EMS vendors or manufacturing groups, yet keep their high expectations of high-quality products and consistent reliability.
One of our customers is a contract electronics manufacturer. He sent this actual example:
Table 1 is an excerpt from an actual customer’s BoM with incomplete data. These incomplete data cause significant time expenditures and delays. For example, on capacitor C101, what voltage rating and tolerance are needed? For the screw and nut, what material (steel, brass, nylon, etc.), and style (slotted, Philips, hex, etc.)?
A number of factors drive the necessity for high-quality data. Shorter product lifecycles coupled with higher reliability expectations and lower cost mean the data should be correct and complete when delivered for manufacturing. The result: a growing need for effective, efficient utilization of intelligent data, from design through manufacturing. It is critical not only that complete and intelligent data be provided to ensure products have the highest quality and reliability, but to meet cost targets and critical release dates.
Consider the importance of the manufacturing utilization of data. Manufacturing groups are highly dependent on product data received to provide outputs and information necessary for a manufacturing process to yield products of high quality and reliability. Manufacturers use these data for a large variety of things: BoM/MRP reports, defect statistics, and other manufacturability reports, DFx analyses (assembly, fabrication, and test), test programs, and other reports and programs. Without the intelligence embedded in good data formats, creation of these outputs is cumbersome, slow, or worse, exposed to error and data integrity issues.
These two examples underscore the importance of high-quality data. Each requires higher quality intelligent data to permit manufacturers to take advantage of advanced solutions for the benefit of their customers (i.e., you):
1. Machine programming process with validation. With data consisting of top/bottom copper layer, silkscreen with polarity, component reference designators, and a BoM with accurate component information, manufacturers can validate SMT machine programs offline for rotation and offset issues at an engineer’s desk ($40-$75/hr. burdened rate), instead of relying on a live pilot run, which ties up production line time ($2,000-$7,000+/hr. burdened rate). 2. Quality data system infrastructure. With data consisting of all board layers (internal and external) and the netlist, manufacturers have the baseline information necessary to streamline test and inspection loops on the shop floor. These data provide the means to quickly analyze and repair errors found through automatically collected test results of printed circuit assemblies using paperless visual aid tools and documentation.
Second, it is critical to understand the importance of the quality of data provided to the front-end process efficiency of your manufacturing group or third-party vendor. The type of data received can result in this process being measured in hours or days. Unintelligent data – single-layer Gerber files, DXF/HPGL files, PDF files (BOM or drawings), paper drawings – can add hours, if not days, to the processing time, just to get started on manufacturing, and significantly increase the cost. Using the same examples, this time with a focus on manufacturing process efficiency, it is easy to see the value of intelligent data.
1. Machine programming process with validation. The use of intelligent data (e.g., ODB++) to create and validate a complete machine program offline can be completed in less than 45 min., compared to 3 to 12 hr. with copper pad Gerber data only and standard BoM files, which lack CPL or IPC-D-356 netlist information. 2. Quality data system infrastructure. Without the use of intelligent data, such as netlist information, integrated into a quality data collection and analysis system, the ability to analyze and repair assemblies quickly and efficiently is a challenge. Using intelligent data can yield review processes that can take minutes, instead of hours spent searching for information on paper drawings and the tedious reviews that follow.
The data a designer provides directly affect downstream process efficiency and the ability to utilize the data effectively for manufacturing processes. The next time you prepare to send a data package to a manufacturer, consider the ramifications of providing insufficient or unintelligent data on the resulting product’s quality, reliability and delivery time.
Michael Dryer is account manager, manufacturing team, Mentor Graphics Valor division (valor.com); This email address is being protected from spambots. You need JavaScript enabled to view it..
Five-and-a-half million: That’s how many light bulbs are purchased each day in the US. And yet, the market for incandescent bulbs is about to burn out. In fact, in Australia legislators have banned light bulbs, and the EU will switch off incandescent and halogen bulbs between 2009 and 2012. The mighty 100W bulb went out last year, and the 60W and 75W versions are next. In the US, the laws against incandescent kick in by 2012. (Halogen isn’t targeted.)
This throws open the door to a huge new market for fabricators and contract assemblers, but there are key differences from traditional SMT boards. In solid-state lighting, for instance, the LED and driver boards are separate, and the typical substrate for the former is metal core, not FR-4.
Thermal management, as our cover story last month detailed, is emphasized. While LEDs don’t throw as much heat as incandescent bulbs, there are still certain thermal issues to contend with. Most solid-state players try to design units that operate under a certain temperature to maximize output. “For an LED board, we look for a certain temperature at the joint,” says Scott Mauldin, director of operations of LEDnovation, a maker of LED lamps and luminaires. “This permits LEDs to get more lumens per watt” (of input).
LED parts for placement typically come on reels and can be put down by almost any decent placement machine. But there are advantages to be had: Smart feeders have a leg up, says Mauldin. Solid-state light manufacturers are interested in bin codes (which define the light characteristics of the LED). Bin codes might be mixed on a board to get the right amount of emitted light, which means assemblers must keep the bins separate.
In soldering, the thermal profile is very different than SMT parts. LEDs are sensitive to high heat. And rework is treacherous, as it is fairly difficult to heat up a single solder joint on a metal core board. (Some use hot plates for rework.)
A company like LEDnovation outsources assembly, emphasizing those with production experience with metal core boards, which eliminates about 80% of EMS companies today. That will need to change.
Mauldin is among the speakers at SMTA International’s EMS Forum (smta.org/smtai) this year. It’s definitely worth looking into.
Trading up. Apex/Expo and Nepcon China certainly showed vast improvement this year. Numbers were up at both shows, a reflection of the improving economy and (somewhat) open checkbooks. Especially noticeable at Apex/Expo was how engineers filled the floor through the third day: I would need a good miner to dig up a memory of the last time that happened. China’s rebound is not so much of a surprise, though it will be interesting to see how much longer that show lasts in the city when the Chinese government is doing all it can to push manufacturing out of Shanghai. And while the bloom is off the rose in Las Vegas, Apex at least demonstrated that North America can for now handle an annual event. (See our full report here.)
Dying dinosaur. The above notwithstanding, if you took $100,000 in cash and several thousands more in time and travel expenses and spent it trying to convince a handful of potential customers to buy your product, sometimes without even bothering to turn that product on, you would be hard pressed to convince an outsider this is a good way to run a business.
Yet, that is exactly what an SMT equipment trade show has come to represent.
That $100,000 – which is hardly a conservative estimate, as freight and hall drayage costs often reach $25,000 for a single placement machine, and many equipment OEMs bring several lines to a single show – would be much better spent sending potential customers plane tickets and picking up hotel accommodations for onsite visits to the suppliers’ demo rooms. After all, at a typical show today, few machines are operating in anything more than dry runs, and many aren’t plugged in at all. They are giant pet rocks. Kicking the proverbial tires is all a customer can do.
Equipment trade shows in our industry are not sustainable. Investing in their survival means spending thousands to chase hundreds. It’s a faulty premise, and it is only a matter of time before this dinosaur goes extinct.
Changes. A warm welcome to Bekah Just, our new production manager, and a sad, sad goodbye to the absolutely unflappable Katie Haddox who, after 12 years with UP Media (and 10 working with me), is leaving to explore California with her two dogs. Each month, Katie’s slim shoulders moved mountains to get the issue designed, laid out, printed and distributed. I wish her the best of luck, and I will miss her tremendously.
Mike Buetow is editor-in-chief of CIRCUITS ASSEMBLY; This email address is being protected from spambots. You need JavaScript enabled to view it..


 Five-and-a-half million: That’s how many light bulbs are purchased each day in the US. And yet, the market for incandescent bulbs is about to burn out. In fact, in Australia legislators have banned light bulbs, and the EU will switch off incandescent and halogen bulbs between 2009 and 2012. The mighty 100W bulb went out last year, and the 60W and 75W versions are next. In the US, the laws against incandescent kick in by 2012. (Halogen isn’t targeted.)