A trio of companies studied a set of microvias that failed during lead-free assembly.
Ed.: Part 1 was published in the June 2006 issue. Part 2 was published in the July 2006 issue. Both parts are included here.
Traditionally microvias have been considered to be the most reliable interconnect structure within a PCB. But with the advent of lead-free assembly, the vulnerability of high-density interconnects to failure has increased. This is due to the elevated temperatures experienced during assembly and rework. Microvias have been found to fail during assembly and in their end-use environment, a trend noticed in North America and Europe in spring 2003.
Curtiss-Wright experienced opens (and intermittent opens) at electrical testing of their PCBs after assembly. Assembly includes double-sided surface-mount components in additional rework procedures when applicable. Assembly and rework procedures were well defined and tightly controlled. The opens demonstrated sensitivity to thermal change and mechanical stress. Specifically, connections became resistive or open under thermal or mechanical stress. Using infrared thermal imaging techniques the defective interconnections were located, and subsequent microscopic evaluation demonstrated random failures associated with microvias. The first microvias reviewed demonstrated a target pad to copper plating separation. A small percentage of microvias exhibited barrel cracks and, on occasion, knee/corner cracks.
These failures were found to be related to specific fabrication date codes and specific vendors. Some of the boards with failing microvia were fabricated by Coretec and were certified compliant to established acceptance criteria. The date codes involved had been tested at PWB Interconnect Solutions and met the established criteria for acceptance for thermal cycle testing of IST coupons.
The reliability test method used throughout this study was interconnect stress testing (IST), as per IPC TM650 - 2.6.26, DC Current Induced Thermal Cycling Test. The associated coupons were preconditioned by exposing them to five thermal excursions to 230°C, in exactly three minutes. This method of preconditioning was established as the standard for Curtiss-Wright based on a significant volume of data points used in previous testing. It is meant to emulate, but not replicate, three assembly cycles and two rework cycles. IST thermal cycling to 150°C was completed on the suspect lot of microvia coupons, the results surpassed the customer's acceptance criteria of a lot mean of 150 cycles, and a minimum of 100 cycles to failure. The suspect lot had achieved a mean of 750 cycles with some coupons achieving a maximum of 1,000 cycles (end of test).
In support of IST evaluations, microsections were used to determine the type and cause of failure. The microsection methods used were in accordance to IPC -650 2.1.1 Microsectioning Manual Method. Microscopic evaluations of microvia were preformed after a mild microetch.
A multidiscipline study was initiated by Curtiss-Wright and undertaken to understand the various types, and mechanisms contributing, to microvia failures focusing on:
1. How to prevent reoccurrence of microvia failures.
2. How to improve test methods to identify suspect microvias and accept reliable microvias.
The joint effort between Curtiss-Wright (OEM and assembler), Coretec (PWB supplier) and PWB Interconnect Solutions was established to resolve these microvia reliability concerns.
This investigation included improvements to metallurgical methods (metrology) necessary to identify and evaluate microvias, analysis of various process parameters required to eliminate the underlying cause of these failures, development of reliability test methodologies to quickly and accurately determine the reliability of microvias and the establishment of criteria for product acceptance or rejection. This study was extended knowing that stress of thermal excursions in a lead-free environment would be significantly higher.
During routine assembly at Curtiss-Wright, a trend was identified where some PCBs had circuits that were open while others exhibited high resistance. This condition was found during testing and rework on PCBs with a specific date code. The first step was a careful review of the assembly and rework processes for any anomalies in practice or procedure. All processes and process parameters were found to be within acceptable limits. Controls were found to be in place and appropriate. There was no evidence of elevated or prolonged thermal excursions. It was demonstrated that the established assembly and rework procedures did not degrade the integrity of the PCBs.
It was concluded that the established IST testing at 150°C did not adequately identify the level of quality on the failing microvias. The coupon from the failing lots had exceeded the established minimum requirements of a mean of 300 and no coupon undergoing less than 150 IST cycles to failure. The failing lot achieved a mean of 782 cycles with a minimum of 563 cycles to failure; one coupon survived to end of test at 1,000 IST cycles.
It was determined that two products were affected: one, already partially delivered and another was a "development model." Delivered product was recalled; both produces were scrapped as per procedure.
In response to these developments two parallel actions were launched. Curtiss-Wright initiated failure location, microsectioning of suspect interconnection with failure analysis on a defective PCBs that had been identified as having several sites of opens or higher resistance interconnections. Microsections indicated some microvias with separation of the target pad and the base of the microvia. The second activity was initiated by PCB Interconnect Solutions to determine how this particular defect could be better detected. A proposal was accepted to explore the possibility to use the remaining IST coupons in an experiment to determine what temperatures may be used to improve the detection of defective microvias.
In conjunction with these actions a more robust material was implemented for PCB fabrication that was better suited to withstand the rigors of assembly and rework, and had a lower coefficient of thermal expansion (CTE) that would reduce the strain generated during the thermal excursions associated with assembly and rework.
The Test Vehicle
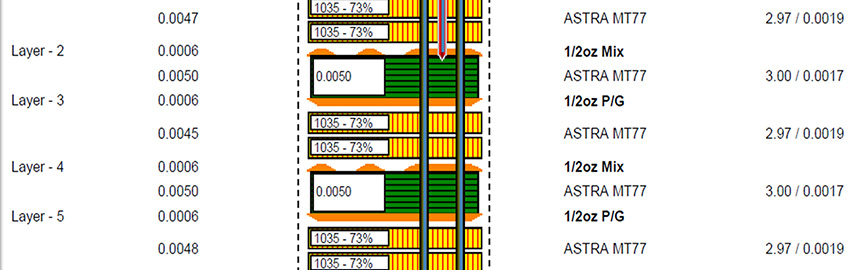
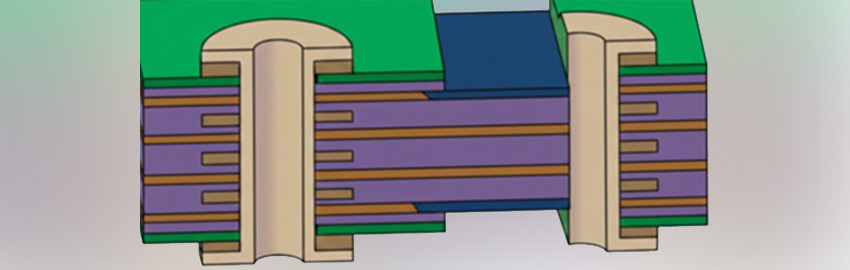
IST coupons are specifically designed to have interconnect structures that are sensitive to increases in resistance. A proprietary method allows IST coupons to be engineered to focus on the robustness of the interconnection of interest. The coupon is also a design large enough to contain hundreds of interconnect structures in order to test a statistically significant sample of interconnects. IST coupons have at least two circuits: a power circuit, P1, used to heat the coupon (and test internal interconnections), and a sense circuit, S1, for testing the interconnect structure of interest. The coupon used in this study, TV16002 (Figure 1), has one power circuit, P1, with a PTH interconnect (layers 1/16) and 3 senses circuits where S1 is a PTH (1/16), S2 is a core via (2/15) and S3 is a microvia (1/2 15/16). Each TV16002 coupon contains 340 microvias.

FIGURE 1. The TV16002B test vehicle coupon.
|
In an IST evaluation, testing automatically stops when a circuit reaches a 10% increase in resistance. The failing coupons have circuits that are still electrically conductive but have a modest increase in resistance. Because the test stopped well before catastrophic failure (open), it is possible to identify the exact microvia that is contributing the highest resistance to the circuit using thermo-graphic techniques.
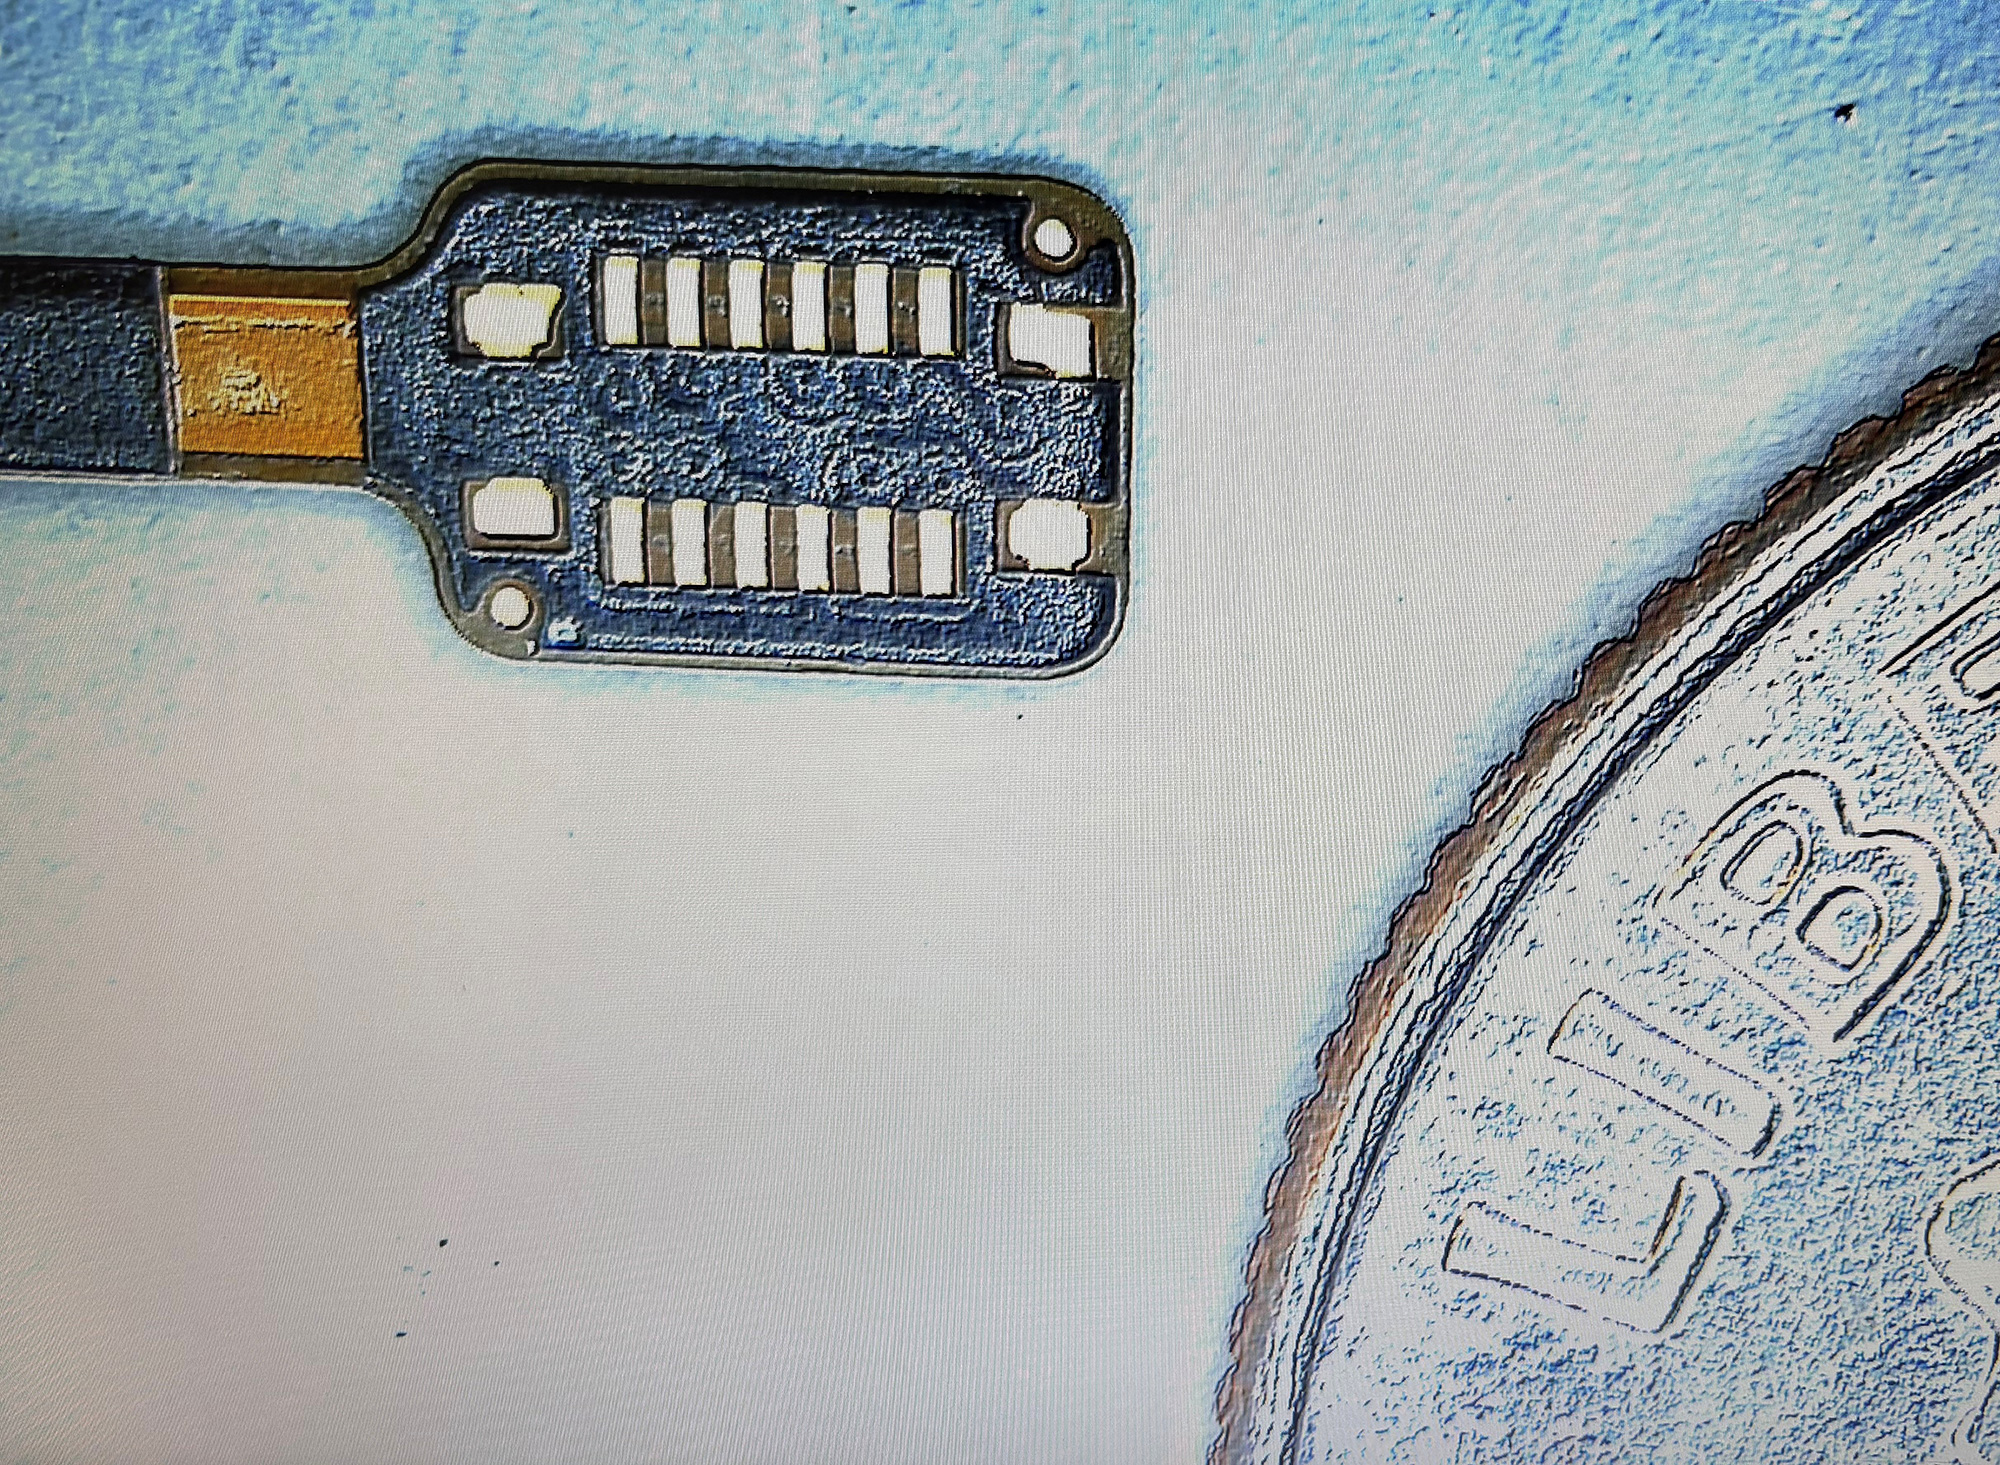
The one worst-case microvia in a group of 340 may be identified using thermal imaging cameras in a technique called "failure location." Since the failed circuit has experienced only a 10% increase in resistance, a DC current can be applied causing the failing interconnection to heat. The compromised microvia has a higher resistance, compared to other connecting traces and other (robust) microvias, and it will become the hottest structure in the coupon, and easily found using a thermographic camera. The thermographic camera allows direct visualization of the exact location of the hottest microvia. The worst-case failing microvia is seen as a high-temperature hot spot on the surface of the coupon (Figure 2). This is a powerful tool for finding failure locations for subsequent microsection analysis.

FIGURE 2. Thermograph of a failing via.
|
Failure Analysis of Microvias
The established method for evaluating microvias by microscopic technique requires that the microvia to target pad interface to be examined without the use of a microetch. Examining an un-etched cross-section of a microvia can be used to good effect in fabrication; however, with thermally stressed microvias in the process of failure, it is more effective to used a mild microetch. Typically a mild microetch is used on microsections to enunciate internal structures within the interconnection. With a microetch, the crystalline structure of the electrolytic copper, the layers and thickness of the electroless copper and microinclusions within or between copper layers are easily seen. It is necessary, for the effective evaluation of a microvia that is beginning to fail and has only a 10% increase in resistance, to use a mild microetch for failure analysis. An aggressive microetch can hide subtle internal structure and create artifacts that could be confused with known defects.

FIGURE 3a. A microvia before etching.
|

FIGURE 3b. An etched microvia.
|
Figures 3a and 3b show a microvia that was photographed before and after etching to demonstrate the degree of detail that may be achieved. In Figure 3a the layer 1 foil interface, electroless copper, interface between the bottom of the microvia and the target pad, and the plating on the top of the target pad are easily visualized after a microetch. In Figure 3b all internal detail is not visible. Microvias evaluated in this study had a mild microetch. It was demonstrated that a well-controlled microetch, using hydrogen peroxide and ammonium hydroxide, greatly enhanced the physical details of the failing interconnect and improved the ability to objectively evaluate failures and causative mechanisms.
IST equipment has the inherent ability to stop testing an individual coupon automatically when it achieves a 10% increase in resistance, in any test circuit. This assures that the failing circuit is stopped before the coupon has achieved a catastrophic failure. Figure 4 is an obviously failing microvia, while Figure 5 has a more subtle failure mode. Both coupons were stopped at a 10% increase in resistance and then identified, with thermal imaging techniques, as the microvias contributing the highest resistance to the failing circuit.

FIGURE 4. An obviously failing microvia contributing a 10% increase in resistance.
|

FIGURE 5. Microvia with a more subtle failure mode contributing a 10% increase in resistance.
|
Armed with these tools, a comprehensive failure analysis can be achieved. Failure analysis suggested that there were two distinct failure mechanisms at work in these coupons. As seen in Figure 6, barrel cracks were found at the base of the hole wall of a few microvias. More commonly debris was under or above the electroless copper deposit, at the interface with the target pad leading to pad separations. The analysis suggested that the dominant underlying contributor to the microvia failures in this study was an inherent weakness at the interconnection between the base of the microvia and the target pad. The electroless and electrolytic copper thinned from the knee to the bottom of the microvia and was believed to be a contributing factor to the barrel cracks.

FIGURE 6. Microvia failure mode - barrel cracks.
|
Characteristics of Failure
After analysis of a large number of failed microvias, some common characteristics became apparent. One of the characteristics of failure due to a target pad separation is that they usually exhibited inclusions between the electroless copper and the target pad, or between the electroless and the electrolytic copper (Figure 7). Because we are viewing failing microvias that have not failed completely (fully separated), we have the opportunity to review the failure in progress. The microsection captures the failure's moment in time. We were able to review the most electrically degraded microvia and the neighboring microvias that are in various stages of failing.

FIGURE 7. Microvia failure mode - pad separation.
|
Frequently failing microvias exhibited precursor "black dots" at the target pad/via-plating boundary. The black dots enlarge into small cracks that then coalesce into large cracks. This process resembles a tearing along perforations in a piece of paper. Often the cracks would appear in the center and at the perimeter at the base of the microvia. Microvias that were advanced in the failing process had the appearance of a crack that started on one side of the base of the microvia and progressed completely across the interface.

FIGURE 8. Precursor "black dots" ...
|

FIGURE 9. ... Coalescing into micro-cracks.
|
Figures 8 and 9 exhibit the precursor black dot above and below the electroless copper. Figure 10 shows coalescing micro-cracks both above and below the electroless copper.

FIGURE 10. Inclusions that coalesce into cracks, with two cracks forming.
|
Another observation is that the electroless and electrolytic copper quickly thins below the knee of the microvia. Electroless that measured 120 millionths of an inch on the surface of the pad can be unmeasurable at the base of the microvia. The thickness of the electroless and electrolytic coppers was reduced, in some cases dramatically, as the deposit descends into the microvia. The effect of thinning electroless can produce a condition commonly called step plating.

FIGURE 11. Thinning of electrolytic and electroless copper below the knee of the hole.
|
Figure 11 demonstrates the reduction in electroless, which is plainly visible on top of the surface foil and only barely discernable at the base of the microvia. Figure 12 is an extreme example of wedge plating on a microvia processed with direct metalization. Usually microvia barrel cracks are associated with process conditions that are rejectable to IPC-6012 or other applicable documents. If these conditions were to be discovered using random microsections, the lot would have been rejected. The problem with thinning copper plating is that this condition is random and may occur anywhere on the board. Not all microvias would have the exact same condition. With the failure location method, it is very successful in finding this condition when it is random in nature.

FIGURE 12. Extreme example of thinning electrolytic and electroless copper.
|
It was found that the shape of the microvia was also contributing to the robustness of a microvias. Bowl-shaped microvias appeared to have a more uniform copper distribution to the base, as compared to cylindrical microvias (Figures 13 and 14). Bowl-shaped microvia were found to achieve higher cycles to failure than cylindrical microvias.

FIGURE 13. Cylindrical microvia.
|

FIGURE 14. Dish-shaped microvia.
|
Armed with improved microsection techniques and a better understanding of the failure modes Coretec investigated methods of improving microvia fabrication and improved reliability.
The majority of microvia production within North America is achieved through laser ablation. Two common laser sources, the UV and CO2 lasers, can be used individually, but the use of hybrid lasers has increased over the past five years. Hybrids are dual laser source machines; the UV laser source oblates the copper on layer 1 and the CO2 laser source oblates the glass and epoxy dielectric, but not the copper.
The wavelength of the CO2 laser is 9.8 µm. Copper is reflective to the 9.8 µm CO2 emission. The reflected beam will cancel the incoming beam due to the 180° phase loss caused by the reflection. This canceling effect will result in a non-absorption zone close to the reflective copper surface. The actual depth of this non-absorption zone varies depending on the condition of the copper surface and the absorption coefficient of the resin. For rough estimation, the non-absorption zone should be thinner than 1é8 of the wavelength, which is 1.2 µm, or 0.000050". In other words, a very thin layer of epoxy will remain on the target pad after CO2 ablation. The existence of this thin epoxy requires an effective process to clean the copper target pads before they can be plated/metalized. This is accomplished through a KMNO4 desmear or plasma process.
If the thin resin layer is not effectively removed, the surface of the copper target pad will not readily accept copper. This is commonly expressed as a "blotchy" condition because some areas of the target pad will accept copper and some areas will not. Electroless copper will cover the thin epoxy layer and following electrolytic copper plating, the via will appear to be cosmetically acceptable. Figures 15-17 show the surface topography at the various process stages.

FIGURE 15. Target pad after laser drilling (debris is visible).
|

FIGURE 16. Target plasma desmear and microetch (some debris remains).
|

FIGURE 17. Target pad after KMNO4 desmear and microetch (clean).
|
With substandard prepping of the target pad, the final microvia will appear to look and function correctly. During a standard thermal cycle test, the microvia will be reported acceptable. However, at elevated test temperatures and lead-free assembly parameters the microvia may fail. With IST testing, through lead-free temperature preconditioning, and elevated thermal cycling, a substandard microvia will be identified. This testing will ensure proper process conditions are employed.
The Physics of Microvia Failure
The majority of the strain exerted on a microvia is from the Z-axis expansion of the dielectric. As the dielectric is heated it expands. The coefficient of thermal expansion (CTE) is the change in thickness of the dielectric per degree centigrade. The CTE of dielectric materials used in PCB fabrication are measured in part per million per degree centigrade (ppm/C). Thermal analysis of the FR-4 epoxy glass laminate shows a CTE that is constant until the glass transition temperature (Tg). At the glass transition temperature the CTE changes, usually increasing by a factor of 3 to 5. A typical CTE of a multilayer board is around 30 ppm/C before Tg and then increases to 150 ppm/C after Tg. Tg is usually found to be between 150°C and 180°C. At temperatures above Tg the amount of strain exerted on the system is significantly increased.
Because the dielectric is very thin in a microvia (.002" to .004"), the amount of strain in the microvia structure is low compared to a PTH or other interconnect structures. In the typical board construction, a microvia is frequently found on the outer layers of the board. In a typical 16-layer construction it sits on top of about .070" of dielectric. The CTE of the dielectric below the microvia is the same as the CTE of the dielectric of the microvia structure. Because there is a greater volume of dielectric below the microvia there is a much greater amount of expansion occurring below it as well. In this study, microvias were frequently found to fail in the beginning of the cooling cycle.
Microvias were found to be open at ambient temperatures and then conductive with the application of heat. It appears that an open microvia - one that has a separation from the base to the target pad - may be affected by the expansion or contraction of the material beneath it. If microvia-to-pad separations occurred during heating, the material below the microvia would drive the target pad into its base. The effect was the appearance of a self-healing intermittent open. During the cooling cycle the target pad may be pulled away from the base causing either high resistance in the circuit or an open.
It is possible for a failed microvia to act as a thermal sensitive switch that is conductive upon heating, then open upon cooling. The microvia may be sensitive to thermal changes or a mechanical deformation typically open without stress. It was frequently found that open circuits, one with failed microvias, could be induced to become conductive with heating or twisting the board. Under thermal or mechanical strain the circuit would be conductive enough to accept a small current, and thermographic techniques would be employed to identify the offending microvia.
Effects of Strain in the Microvia
The main cause of strain on the microvia during thermal excursion is from the Z-axis expansion of the dielectric between the top of the microvia (outer layer) and the capture/target pad. The amount of strain exerted in the microvia structure is in proportion to the thickness of the dielectric. The amount of stress in the system is a function of thickness dielectric, surface area, shear forces and the visco-elastic properties of the dielectric. Our discussion will be limited to strain.
It is obvious that the relatively thin dielectric between the two copper layers of a microvia structure (as compared to the dielectric thickness between layers 1 and 16 in a PTH) is the major contributing factor to why the microvia is said to be the strongest interconnect. There is only .002" to .004" of dielectric to exert strain on the microvia. Microvias are the least stressed electrical interconnection in a typical PCB and therefore considered the strongest interconnection structure.
PWB Inc. undertook the study to determine the most effective IST testing parameters for determining whether microvias were robust. It was decided that five cycles of preconditioning to 230°C required by Curtiss-Wright would be kept as a constant. After preconditioning, known discrepant microvia coupons were tested to temperatures of 150°C, 170°C, 190°C, 210°C and 220°C. The most significant finding was that the coupons known to be discrepant survived to the end of test when tested at 150°C. Coupons tested at 170°C survived with a mean of 789 thermal cycles to failure. It was not until test temperatures reached 190°C that coupons were failing below 500 cycles (Table 1 [PDF format]
).
Artifacts in Failure Analysis
Failure analysis of coupons IST tested at 210°C or higher revealed failures due to microvia separation, but there were also knee cracks, material delamination and breakdown, and barrel cracks. The knee cracks, delamination and material breakdown were considered testing artifacts. It appears that cycle testing at 210°C starts the chemical breakdown of the dielectric. Stress from Z-axis expansion is effectively introduced into the microvia at very high testing temperatures and creates pad separation failures in the same manner as 190°C testing, but superimposed on this failure mode is effects of material failure. CTEs at 210°C are so high that the materials begin to delaminate, the pads experience a significant degree of pad rotation with knee cracks and the material darkens as if it were burned.
Even though the 210°C tests easily demonstrated that the microvias were not robust, the presence of artifacts was considered to be an undesirable condition. At 190°C the coupons appeared to exhibit the same failure mode as seen in PCBs that failed during assembly.
Based on this data, the IST testing temperature for microvia reliability was raised to 190°C (microvia testing only). The cycles to failure of known marginal coupons were determined to be less than 500 cycles. By testing to 1,000 cycles at 190°C, IST is capable of differentiating between good and marginal coupons.
A control test of well made microvias, which did not exhibit inclusion, black dots or copper plating concerns, were subjected to 1,000 IST thermal excursion after 5X 230°C preconditioning. The results were no failures at end of test, 1,000 cycles. Robust microvias easily survive 190°C testing to 1,000 cycles.
Based on this data, Curtiss-Wright implemented a 190°C test protocol for microvias. With the improvements made in fabrication and the extra advantage of specifying a high-reliability material, microvias have not been a problem in assembly, rework or in the field.
Effects of Lead-Free RoHS Assembly and Rework
An extension of this study was undertaken to see the effect of lead-free assembly on known marginal microvias. A group of coupons that had known marginal microvias were preconditioned six times at 260°C. The first six coupons failed in the first cycle at 190°C. It was decided to test this set of coupons at the conservative temperature of 150°C in order to obtain any qualitative results. The effect of lead-free preconditioning on microvias is profound. The most recent data suggests that the coupons that were able to achieve 788 cycles at 150°C were reduced to a mean of 443 after 6X 230°C and 4 cycles after lead-free preconditioning of 6X 260°C (Table 2 [PDF format]
).
Another way to look at this data is to consider the robustness of a coupon in the "as received" state as the coupons entitlement. The entitlement would be the aggregate of the relative quality of fabrication, the material and the board design expressed in thermal cycles to failure. The thermal excursions seen in the assembly and rework will cause the degradation of this entitlement. The coupons tested in this part of the study had an entitlement of 788 cycles in the as received condition, or 100%. After precondition at tin-lead temperature (6X 230°C to emulate assembly and rework) the entitlement was reduced to 56%, and with lead-free assembly emulation the entitlement dropped to 1%. Lead-free assembly and rework reduced the cycles to failure by 99%.
A group of known good microvia coupons were subjected to lead-free preconditioning by exposing them to six cycles to 260°C. The samples were then subjected to 2,000 thermal cycles of 190°C. The "as received" coupon achieved a mean of 1,923 +/-155 cycles to failure. The preconditioned coupons achieved a mean of 1,549 +/- 649 cycles to failure. The reduction in cycles to failure on well-fabricated microvias was only 20% at 2,000 thermal cycles.
It appears that RoHS assembly and rework temperatures requirements will be adding enough extra stress that any marginal microvias are likely to fail at assembly. PCD&M
Paul Andrews is quality specialist for PWBs and final quality control manager at Curtiss-Wright Controls Embedded Computing; This email address is being protected from spambots. You need JavaScript enabled to view it.. Gareth Parry is CTO of Coretec in Ontario; This email address is being protected from spambots. You need JavaScript enabled to view it.. Paul Reid is program coordinator at PWB Interconnect Solutions in Ontario, Canada; This email address is being protected from spambots. You need JavaScript enabled to view it..
ACKNOWLEDGEMENTS
Appreciation is extended to the management of Curtiss-Wright Controls, Coretec Inc. and PWB Interconnect Solutions for the release of IST test results, fabrication considerations and corrective actions in support of this case study. This work was made possible with the equipment and technical knowledge of the personnel at PWB Interconnect Solutions, especially Bill Birch, Neil Copeman, Alex Mendicino and Jason Furlong. Refinements in metallurgical technique were achieved with the support of Flavio Brutesco.