Question from Raul in San Jose: I heard that as you bring two traces together in a differential pair the resistance in each trace dramatically increases due to the proximity effect. How much does the resistance in each line increase?
Answer: The question is about coupling between the two signal lines that make up a differential pair. Is tight coupling or loose coupling preferred?
There are multiple right answers, depending on the specific tradeoff balance you seek. The looser the spacing, the wider the line can be, so the lower the resistive loss, for the same dielectric thickness. For a given line width, loose coupling also allows the thinnest dielectric. Routing of the two lines is easier as each line can be routed independent of the other. However, loose coupling requires more real estate since the routing pitch is larger.
Tight coupling will mean a thicker dielectric layer for the same line width but a tighter routing pitch and higher interconnect density. In tighter coupled lines the proximity effect causes current crowding in adjacent traces, increasing the resistance of each line. The tighter the coupling, the more the current in each trace will tend toward adjacent edges of the traces, causing the resistance to increase.
With signal integrity issues, just because something will happen in principle doesn’t mean it is enough of an effect to worry about. Sometimes it is just a distraction. This is often the origin of myths in signal integrity. How do we separate a myth from reality? The only way is to put in the numbers.
In this case, we need to be able to calculate the current distribution in the conductors in a differential pair, taking into account the influence of the adjacent trace and all the geometry issues. The best tool for this is Ansoft’s SI2D field solver tool.
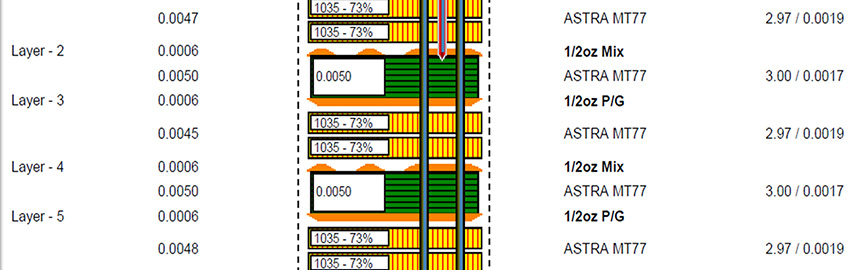
As a test vehicle, we’ll look at a 100-Ohm differential stripline pair in FR-4 with a Dk = 4, and 5 mil wide lines, made from half ounce copper with a trace thickness of 0.7 mils. To start out, the two lines will have no coupling, with a spacing of 20 mils. The current distribution in the conductors will be frequency dependent due to skin depth effects. This will drive the currents within each conductor as far apart as they can go, and, at the same time, the currents in opposite conductors will get as close together as possible.
At 1 GHz the skin depth is 2 microns, too thin to see on any reasonable plot since this is only about 10% of the total trace thickness. Instead, we can plot the current distribution in each conductor at 200 MHz, where the skin depth is about 5 microns (about 1/3 the total thickness of the trace).
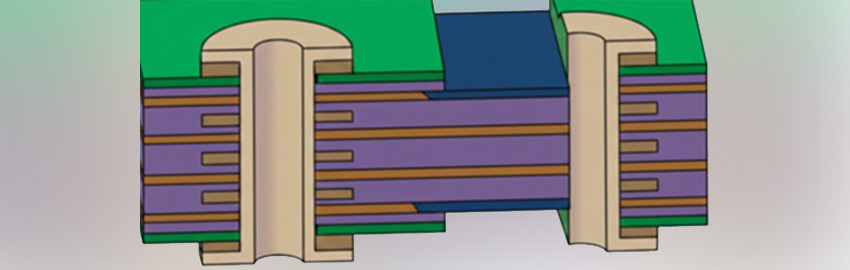
In Figure 1 we compare the current distribution in the two conductors of the differential pair when far apart with no coupling, and then when they are as close together as possible with a spacing of 5 mils.
|

|
|

FIGURE 1. (a) Magnitude of the current distribution at 200 MHz in loosely coupled, and (b) tightly coupled 100-Ohm stripline, simulated with Ansoft SI2D. Note- the direction of the current is opposite in each conductor.
|
Of course, with a spacing of 5 mils the impedance will be slightly less than 100 Ohms, due to the tighter coupling. There is a slight difference in the current distribution between the two coupling cases. The proximity effect – the current crowding in the edges adjacent to each other – is just barely perceptible in the 5-mil space pair. It is clearly a small effect. In addition, there is a very slightly perceptible effect on the return currents. The return currents spread out in the planes slightly at 200 MHz and there is some cancellation in the tightly coupled case.
What impact will this current distribution have on the resistance? The higher current density in one trace is offset by the reduction in net current in each trace due to the induced current and reduction in the net magnitude of current in the return path. This is caused by the cancellation of oppositely moving currents.
We can calculate the total resistance of the differential signal, including the resistance in the return path, for the case of tight coupling and no coupling (Figure 2).
|

FIGURE 2. The calculated resistance per length in tightly coupled and loosely coupled 100-Ohm differential stripline.
|
There is less than a 2% difference in the series resistance of the two cases. This would easily be swamped by such effects as trace etch-back and surface roughness. When we put in the numbers, we see that while the proximity effect does happen, the magnitude makes it a third order effect and not one to distract us from the really first order problems. PCD&M
This and other topics are covered in the public classes Eric teaches. Check BeTheSignal.com for the schedule. Send questions to This email address is being protected from spambots. You need JavaScript enabled to view it..
Dr. Eric Bogatin is president of Bogatin Enterprises.