A review of RoHS compliant hot air leveled options.
Until recently more than 80% of all PCBs produced worldwide were hot air leveled. Today, still more than 60% of all PCBs undergo HAL. Yet most studies conducted so far used PCBs with finishes of ENIG, immersion silver, immersion tin and organic solder preservative (OSP). Lead-free hot air leveled PCBs invariably have been excluded.
Numerous lead-free alloys can be eliminated from consideration for use in HAL and assembly (wave soldering and paste) for reasons of cost, availability of alloy constituents, compatibility with other solder alloys or soldering processes, or reliability considerations. Those remaining can be sorted into two main groups: SnAgCu alloys and SnCu alloys. Although there is a substantial difference (44°C) between the melting points of SnCu-based alloys and SnPb37, the actual difference in the process temperatures these two alloys are used at, both in assembly and HAL, is 10 to 20°C. SnPb alloys are usually run at temperatures of 250° to 260°C, whereas SnCuCo alloys are processed at temperatures in the range of 260° to 270°C and SAC305 at 255° to 265°C in HAL, wave and SMT soldering equipment.
TABLE 1 details the physical properties for some lead-free and SnPb alloys.
When choosing a lead-free alloy, either binary or tertiary, several considerations should be kept in mind. First, a binary alloy is much easier than a tertiary alloy to keep in spec. Second, the 10°C difference in melting temperature means little in a through-hole wave soldering application but that same 10°C may be significant in a reflow oven, where dwell times are longer. Also, as both alloys are compatible with all other board finishes, there seems to be little justification to spend extra money on a silver-containing alloy for wave soldering and HAL.
Wetting Balance Tests
It would be expected that the ideal lead-free replacement solder, in order to yield results comparable to SnPb37 solder, would wet copper surfaces as well as SnPb37. Wetting balance tests were conducted on the SnCuCo alloy to determine if an optimal wetting temperature existed. The test was used as a means to compare the wetting characteristics of the SnCuCo alloy to that of SnPb37. Testing was conducted on a Metronelec wetting balance.
Wetting balance tests were first conducted at 250°C for SnPb37 (its recommended operating temperature) to establish a baseline to which the lead-free alloy could be compared (
FIGURE 1).
SnPb37 Alloy
- Temperature: 250°C.
- Maximum wetting force: 0.32 mN/mm.
- Time to achieve maximum wetting: 0.241 sec.
- Average force at 1.125 sec.: 0.32 mN/mm.
Next, wetting balance tests were conducted on the SnCuCo alloy at temperatures of 250°C, 255°C, 265°C and 275°C (
FIGURE 2).
SnCuCo Alloy
- Temperature: 250°C 255°C 265°C 275°C
- Maximum wetting force (mN/mm): ~0.30 ~0.30 >0.31 >0.31
- Time to achieve max. wetting force (sec.): ~0.27 ~0.26 ~0.24 ~0.24
- Average force at 1.125 sec. (mN/mm): 0.29 0.30 0.31 0.30
Test Results Discussion
Looking at the results with the time scale set to the test time (10 sec.) there is little to differentiate between the two groups. A statistical examination of the spread shows that SnPb37 is statistically different to lead-free at all temperatures. A closer examination of the initial 1-sec. of wetting, important given the potential 2-sec. of average contact time in HAL and wave soldering and longer contact time in reflow, shows the differences between the groups. In an ideal wetting scenario the initial rise to maximum wetting should be as steep as possible. The slope of the SnPb37 was almost uniform in its rise. Leadfree at 250°C and 255°C has a slower initial wetting. At 265°C and 275°C the rate of rise more closely approximated the ideal shape. For SnPb37 solder wetting was instantaneous; rising to maximum wetting force in 0.241 sec. Maximum wetting force was 0.32mN.mm of wet length. For SnCuCo at 265°C wetting was also instantaneous. The rate of rise was uniform, near textbook, and the maximum wetting force was slightly lower at 0.31mN/mm. For SnCuCo at 275°C wetting was also instantaneous. The rate of rise was very similar to the SnPb37 group, and the maximum wetting force was just slightly lower at 0.31mN/mm.
The wetting characteristics for Sn99.5Cu0.3Co can be made to simulate that of SnPb37 with an increase in the operating temperature of between 15° to 25°C. Increased preheat in production may be able to help compensate for this required temperature increase, which should help control the dissolution rate of copper. Wetting forces at the increased temperature are also improved to match that of SnPb37.
Copper Loading Capacity of Solder
There are substantial data available as to how much copper content can be tolerated in a SnPb37 operation. J-STD-001 shows a maximum copper content of 0.3%. Experience gained through years of SnPb soldering revealed that the performance of solder was adversely affected when the copper content reached approximately 0.5% at operating temperatures between 250°C and 260° C. Unfortunately, similar data do not (yet) exist for lead-free solder alloys. The eutectic SnCu alloy of SnCu0.7 already has a copper content greater than what can be tolerated in a SnPb soldering process.
We conducted an experiment to determine if there is a correlation between a novel lead-free alloy and SnPb solder with regard to copper concentration. Pure copper sections of identical shape and weight were introduced into SnCuCo and SnPb molten solder baths at various temperatures. The experimental bath temperatures were selected for the purpose of simulating potential operating temperatures. The copper pieces were immersed in circulating solder baths for 15-minute periods. The copper piece was removed after 15 minutes and a sample was drawn from the solder bath. The solder samples were analyzed on an Emission Spectrophotometer and then returned to the solder bath.
The data in
TABLE 2 indicate that the rate that copper is dissolved is a function of both temperature and existing copper concentration. The dissolution rate increases as temperature increases, and rate decreases as copper concentration increases. The data for the two alloys’ recommended operating temperatures (250°C for SnPb37 and 265°C for SnCuCo) is of particular interest. The data points for these two alloys at their recommended operating temperatures were plotted on a graph and then fitted to a logarithmic regression curve (
FIGURES 3 and
4).
Discussion
A review of the SnPb37 graph shows an initial rapid rise in the dissolution rate to a copper concentration of 0.1% and then a steady rise to a concentration of 0.35%, whereupon it levels to an almost flat rate at 0.40%. Industry experience has shown that performance of the solder begins to deteriorate at around this copper concentration. Very objectionable results are obtained when solder content reaches 0.5%.
Extrapolating this knowledge to the data obtained for the SnCuCo alloy, one can expect to obtain satisfactory performance from the solder up to a copper concentration of about 0.85% and poor performance above 1.0% when the solder is maintained at an operating temperature of 265°C.
Some other noteworthy observations include that copper dissolved at a much slower rate for fresh SnCuCo with an initial copper concentration of approximately 0.3% than for fresh SnPb37 with 0% copper across all temperatures studied. Further, both the lead-free alloy and SnPb37 were extremely grainy and sluggish close to their saturation points.
Copper Thickness Reduction
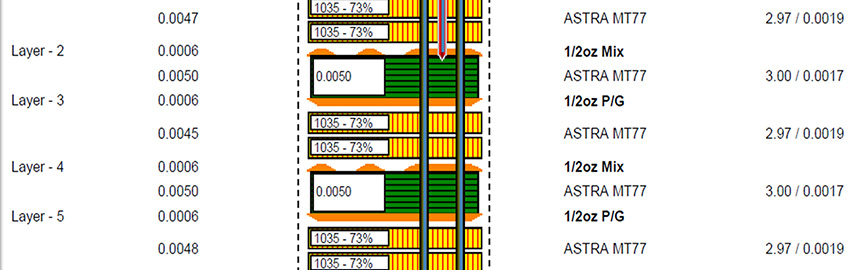
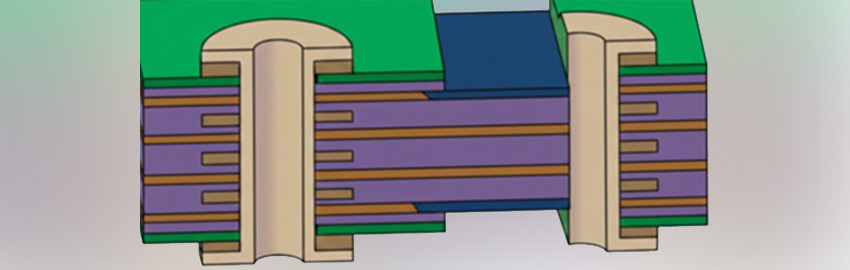
Speculation exists that excessive amounts of copper would be removed from PCBs if hot air leveled with high-tin lead-free solders at higher process temperatures. To determine whether there is reason for concern, a study was conducted wherein PCBs were hot air leveled with multiple passes. As is evident from the data, there was no difference between the SnCuCo alloy and SnPb37 regarding the amount of copper removed from the PCBs.
After one pass less copper was removed with the leadfree alloy than with the SnPb37 solder. Also, after two passes only 12.5% and 10% was removed, and after three passes only 25% and 20% of the copper was removed (
TABLE 3).
As mentioned, the percentage of PCBs fabricated with the HAL process is down from a high of 80% of all boards produced to about 60%. This reduction as a final PCB finish coincides with the substantial growth in SMT, which requires flat uniform (coplanar) surfaces. The traditional SnPb HAL process was unable to provide SMT boards with satisfactory coplanarity. The question to be posed with lead-free HAL: are lead-free HAL boards better, worse or the same as SnPb HAL PCBs with regard to coplanar surfaces? Initial side-by-side trials have indicated that SnCuCo has produced slightly thinner, more coplanar coatings than the traditional SnPb eutectic. These results are constant from study to study.
TABLE 4 shows results for one of these trials from a horizontal HAL machine.
Spread Test Results
Several board finishes, including HAL solder coatings, are available. In order to determine how the SAC305 and SnCuCo pastes wet, extensive tests were conducted for all available board finishes by screening a known amount of each paste on coupons coated with different board finishes and reflowing them at recommended operating temperatures for SAC305 (255°C) and SnCuCo (265°C).
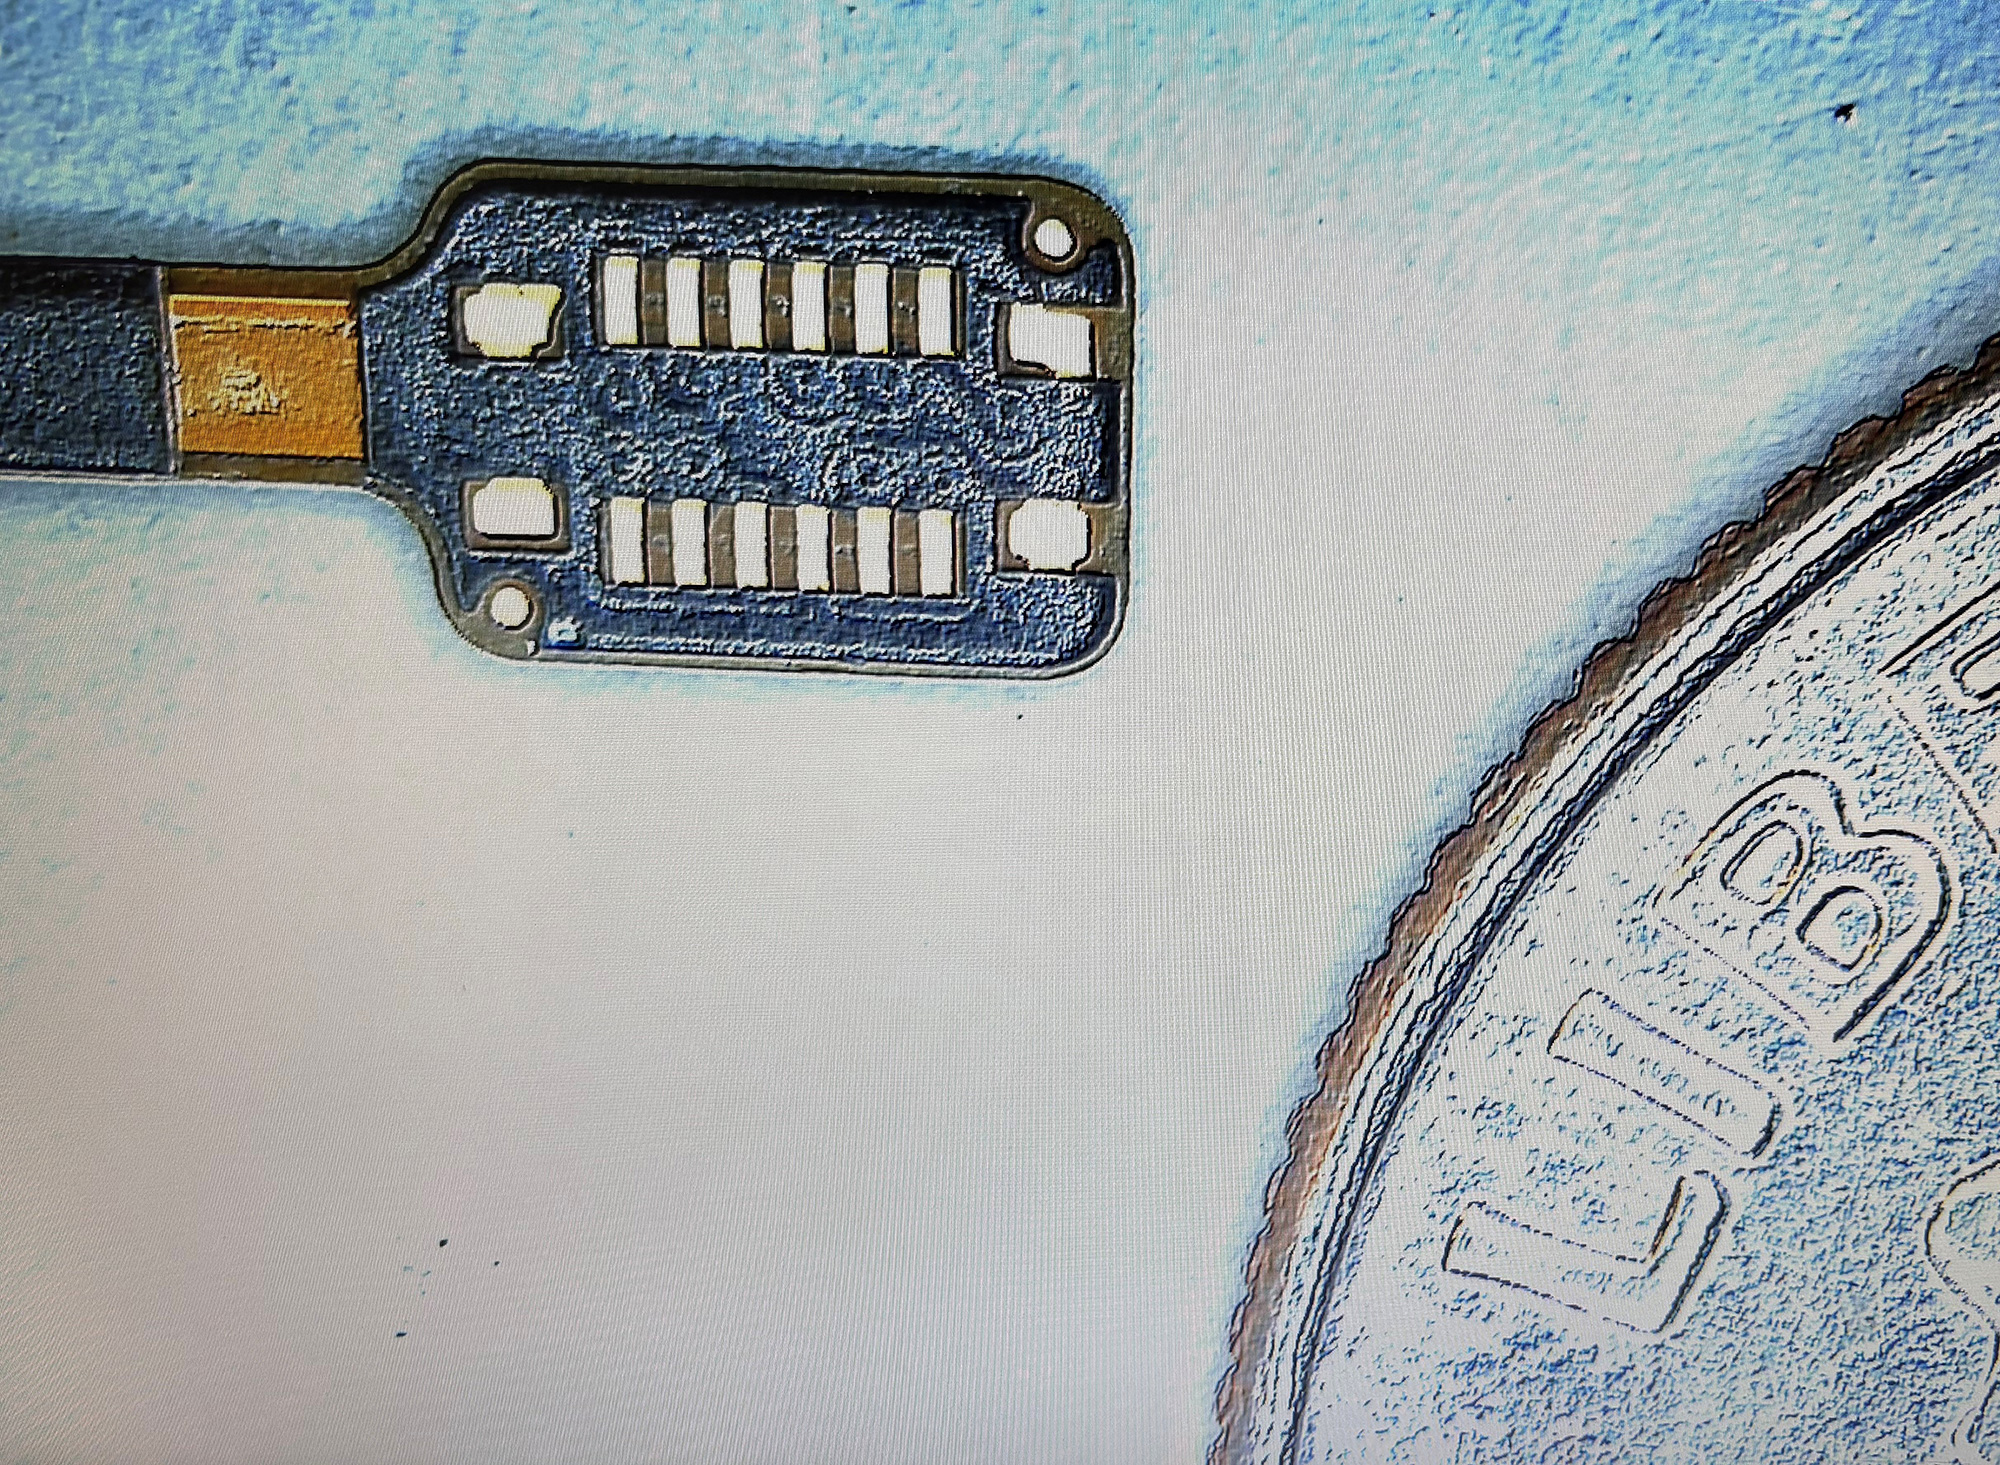
FIGURE 5 shows the wettability of SnPb37 water-soluble and no-clean pastes on five types of board finishes. (For each of the 10 test coupons the far left column contains the HAL finish followed by OSP, immersion Sn, immersion Ag and ENIG.) Test results show that immersion Ag, in both cases, yielded poor wetting followed by ENIG and OSP. In the case of immersion Sn (column 3), the solder paste diffused into the underlying copper surface, forming intermetallic crystals.
FIGURE 6 shows the magnified versions of the diffusion of pastes through the thin layer of immersion tin (as it melts easily at reflow temperatures) into the copper surface resulting in the formation of intermetallics, which could result in poor solderability. Referring to Figure 5, the HAL coupons showed a larger wetting area than the ones produced by OSP, immersion Ag and ENIG. The spread was even with no diffusion into underlying copper.
FIGURE 7 shows wetting characteristics of SAC305 water-soluble and no-clean pastes on similar sets of board finishes. Again, immersion Ag yielded the poorest wetting followed by OSP, ENIG and immersion Sn. HAL coupons in both cases showed larger wetting areas.
FIGURE 8 shows wetting characteristics of the SnCuCo alloy. The results were very similar to those of SAC305 across the board with all different types of finishes. This indicates that the low cost SnCuCo performs at least as good as the high cost SAC305 in wetting boards.
For ease of comparison,
FIGURE 9 shows the wetting characteristics of SnCuCo and SAC305 on all five board finishes. Again, the HAL coating gives the best wetting followed by immersion Sn, ENIG, OSP and immersion Ag.
Wetting Tests Summary
In summary, here’s how the finishes performed:
- ENIG: Poor wetting. However, the standard SnPb37 paste provides about 20% more spread than the SAC305 and SnCuCo pastes.
- Immersion Ag: Poor wetting with all pastes.
- OSP: Poor wetting with cobalt and SAC alloys. Standard SnPb37 shows about 30% better wetting.
- Immersion Sn: Standard SnPb37 tends to totally defuse through the very thin coating of molten tin onto the underlying copper. It shows evidence of intermetallics at the outer edges of the spread.
- HAL: SnPb37 shows better wetting with no intermetallics on the edges of the spread. It also shows moderate wetting with cobalt and SAC alloys.
- The HAL board coating resulted in the best wetting overall, independent of paste.
- Cobalt’s wetting is as good as that of SAC. The lowercost cobalt is therefore a better alternative to SAC.
- Paste tends to diffuse through a tin layer into copper, causing copper nodules.
- Immersion Ag exhibited poorest wetting across the board.
- ENIG and OSP were a little better with SnPb37 pastes.
FIGURE 10 shows the average comparative spread of all alloys tested for each board finish. The results show that no matter the lead-free paste alloy, all pastes work better on a HAL board finish.
FIGURES 11 and
12 show that both leadfree alloys perform about the same, no matter which board finish is used.
HOWARD STEVENS is vice president sales and marketing at Metallic Resources Inc.;
This email address is being protected from spambots. You need JavaScript enabled to view it..
DR. NIMAL LIYANAGE is director of new business development, PC Fab at Metallic Resources;
This email address is being protected from spambots. You need JavaScript enabled to view it..